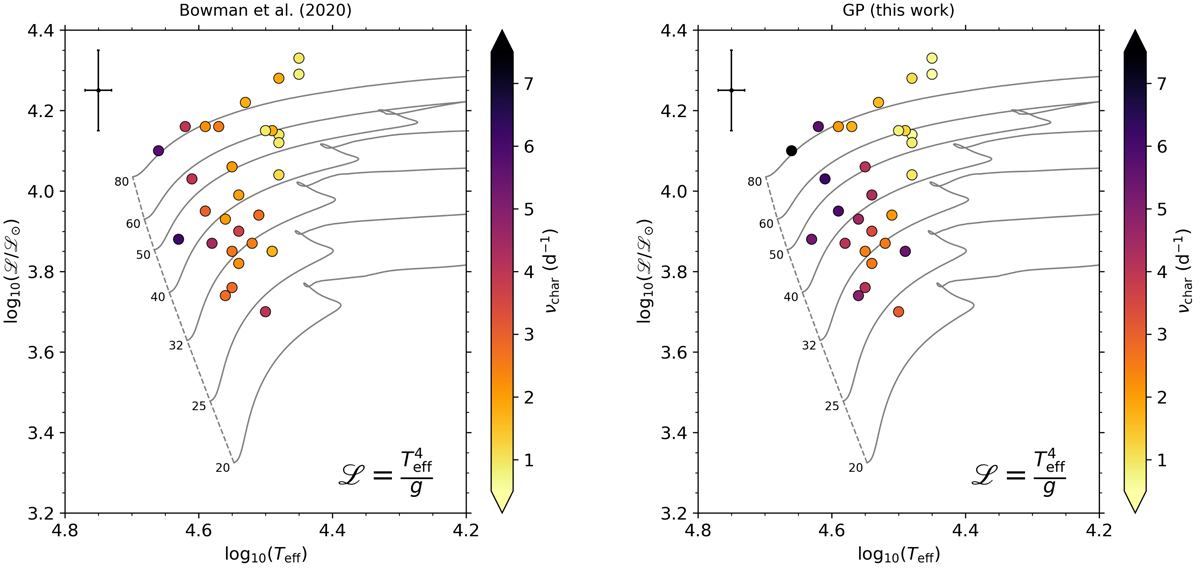
Fig. 3.
Download original image
Spectroscopic HR diagram of 30 O stars determined by Bowman et al. (2020) to be dominated by SLF variability in their TESS light curves (left panel) that we re-model using GP regression in this work (right panel), which are colour-coded by their corresponding νchar values. Evolutionary tracks from Burssens et al. (2020) are shown as solid grey lines and labelled in units of M⊙, and the dashed grey line represents the ZAMS. A typical spectroscopic error bar for the sample is shown in the top-left corner.
Current usage metrics show cumulative count of Article Views (full-text article views including HTML views, PDF and ePub downloads, according to the available data) and Abstracts Views on Vision4Press platform.
Data correspond to usage on the plateform after 2015. The current usage metrics is available 48-96 hours after online publication and is updated daily on week days.
Initial download of the metrics may take a while.