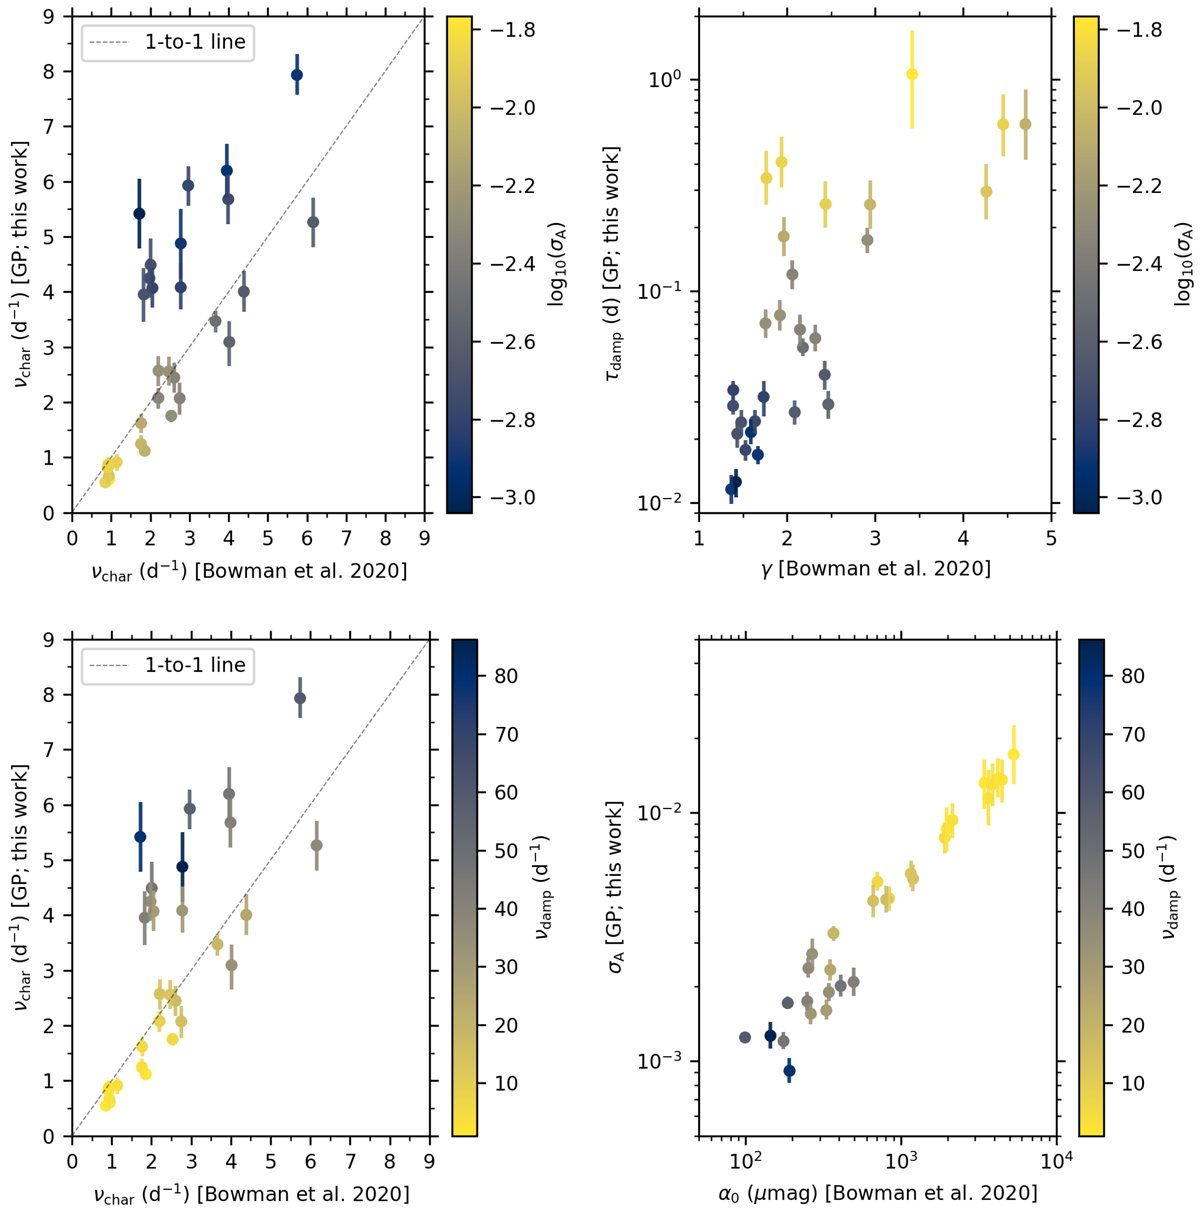
Fig. 2.
Download original image
Comparison of GP regression parameters determined in this work and equivalent parameters from Bowman et al. (2020). Top-left panel: νchar values colour coded by σA. Top-right panel: τdamp values from the GP regression and the steepness of the amplitude spectrum, γ, colour coded by σA. Bottom-left panel: νchar values colour coded by νdamp. Bottom-right panel: σA values from the GP regression and α0 colour coded by νdamp.
Current usage metrics show cumulative count of Article Views (full-text article views including HTML views, PDF and ePub downloads, according to the available data) and Abstracts Views on Vision4Press platform.
Data correspond to usage on the plateform after 2015. The current usage metrics is available 48-96 hours after online publication and is updated daily on week days.
Initial download of the metrics may take a while.