Open Access
Fig. 1.
Download original image
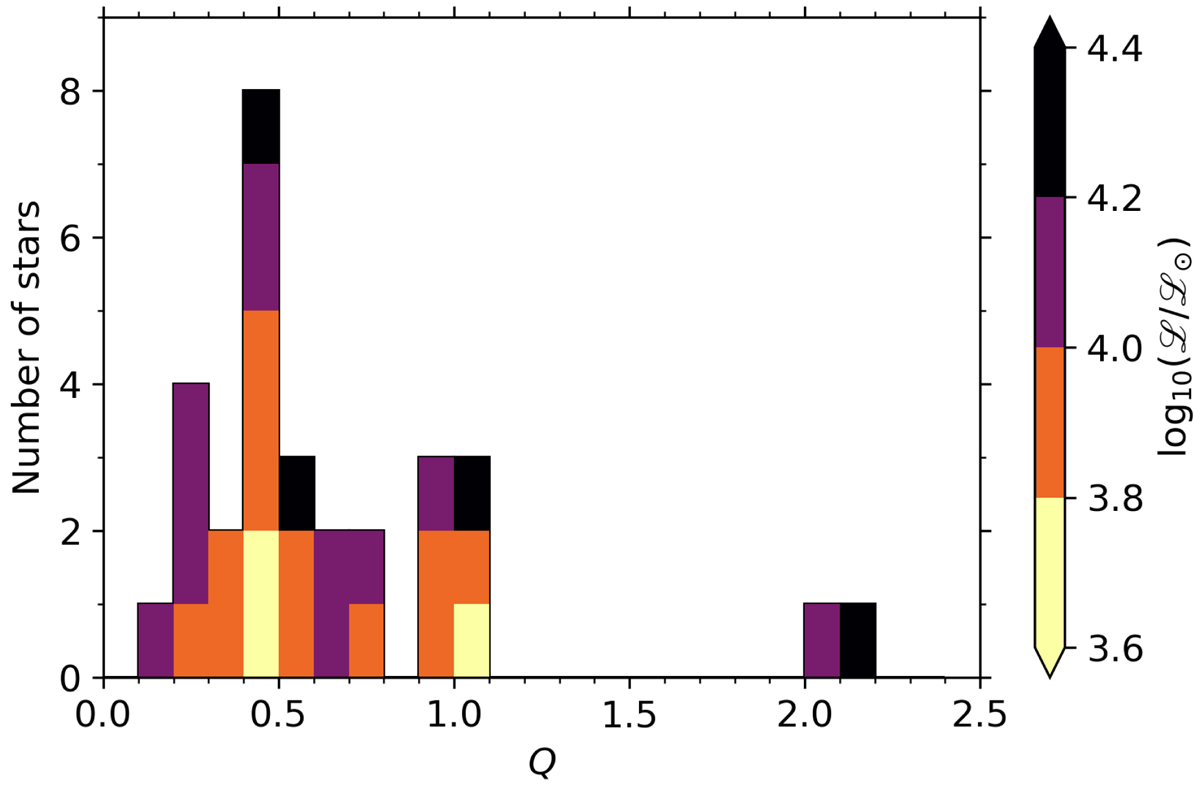
Histogram of inferred Q values from the GP regression colour coded by their spectroscopic effective luminosity. The determined values are clustered around ![]() .
.
Current usage metrics show cumulative count of Article Views (full-text article views including HTML views, PDF and ePub downloads, according to the available data) and Abstracts Views on Vision4Press platform.
Data correspond to usage on the plateform after 2015. The current usage metrics is available 48-96 hours after online publication and is updated daily on week days.
Initial download of the metrics may take a while.