Fig. 4
Download original image
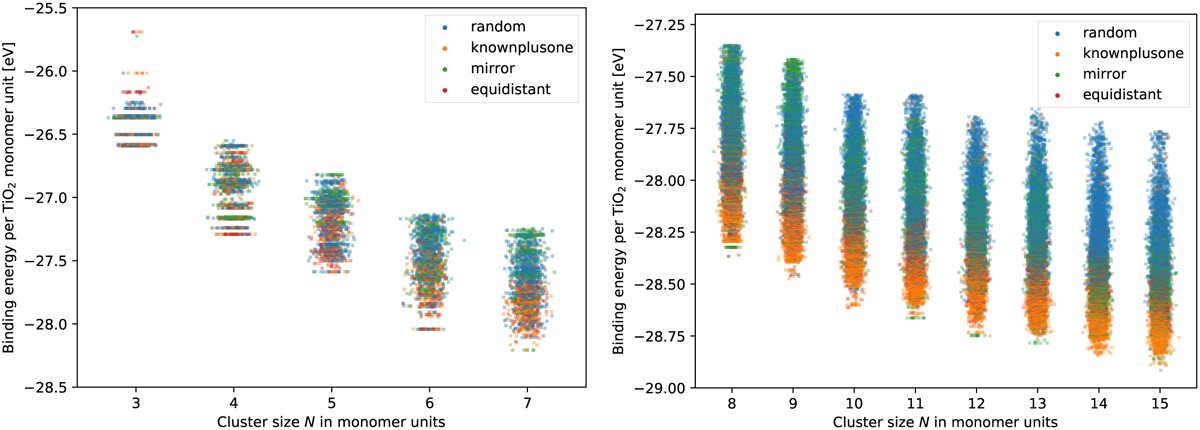
Binding energy per TiO2 monomer unit for small (N = 3–7, left) and large (N = 8–15, right) clusters for the best 90% of clusters after optimisation with the DFTB approach. Individual clusters are colour-coded according to the method of creating the candidate cluster (Sect. 2.1). A random spread along the x-axis has been added to enable comparison between clusters at similar energies.
Current usage metrics show cumulative count of Article Views (full-text article views including HTML views, PDF and ePub downloads, according to the available data) and Abstracts Views on Vision4Press platform.
Data correspond to usage on the plateform after 2015. The current usage metrics is available 48-96 hours after online publication and is updated daily on week days.
Initial download of the metrics may take a while.