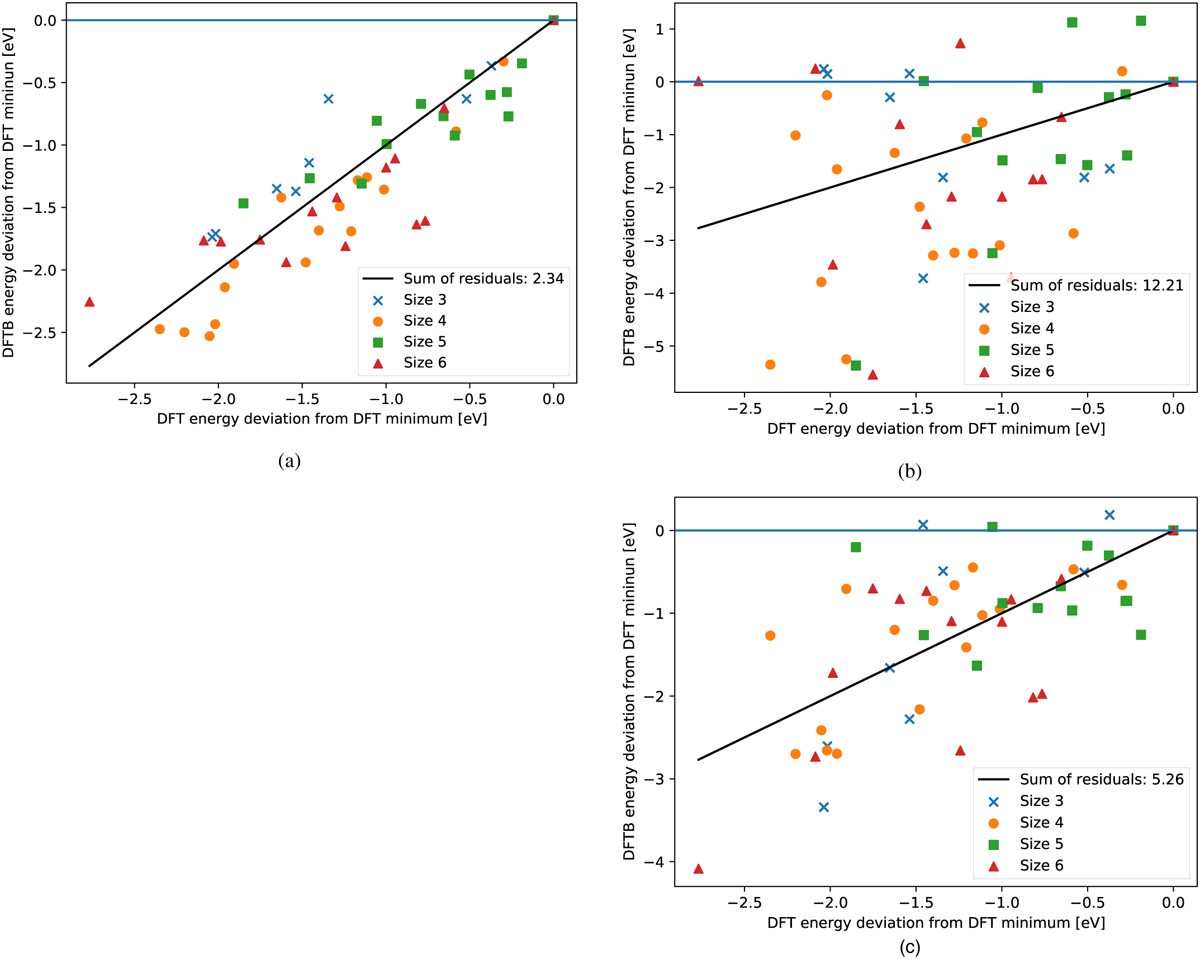
Fig. D.2
Download original image
Comparison of the DFT and DFTB energetic orderings for three different sets of Slater-Koster integrals. (a): Matsci Slater-Koster integrals. (b): Trans3d Slater-Koster integrals. (c): Tiorg Slater-Koster integrals. The positions of all isomers on the x-axis are consistent in all three panels. The energy level of the global minimum according to DFT is given by the horizontal blue lines. The relative energetic ordering from the DFT calculations is given by their order from right to left, and the DFTB ordering is given from top to bottom.
Current usage metrics show cumulative count of Article Views (full-text article views including HTML views, PDF and ePub downloads, according to the available data) and Abstracts Views on Vision4Press platform.
Data correspond to usage on the plateform after 2015. The current usage metrics is available 48-96 hours after online publication and is updated daily on week days.
Initial download of the metrics may take a while.