Fig. D.1
Download original image
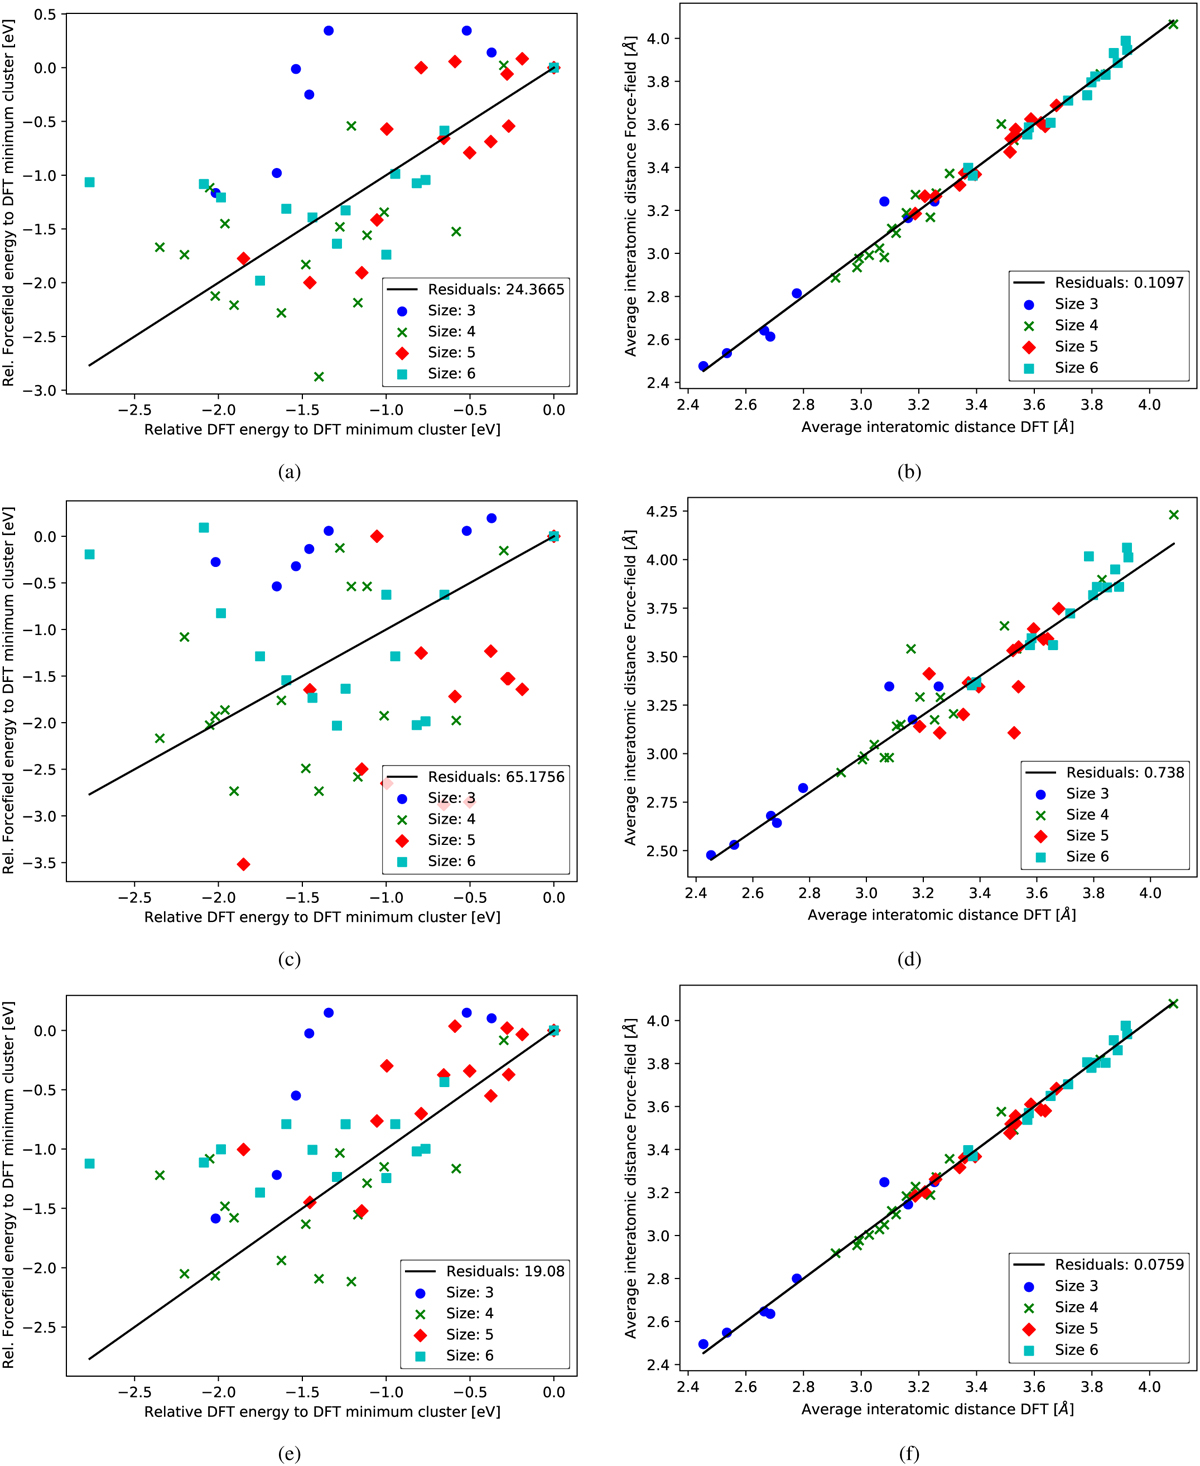
Calibration comparisons for the force-field approach. Left: Relative energy deviation to the global minimum cluster for the force-field approach vs the DFT approach for all clusters from Sect. 2.4.1. Ideally, if the force field approach exactly reproduced the results of the more accurate DFT approach, all points would be on the black line with slope 1. Right: Distance parameter DD for all clusters from the force-field paramterisation vs the DFT approach. In an ideal scenario, all clusters are exactly reproduced and therefore do not deviate from the black line with slope 1. Parameters in the top panel are from Lamiel-Garcia et al. (2017), in the middle panel from Matsui & Akaogi (1991), and in the bottom panel from this work.
Current usage metrics show cumulative count of Article Views (full-text article views including HTML views, PDF and ePub downloads, according to the available data) and Abstracts Views on Vision4Press platform.
Data correspond to usage on the plateform after 2015. The current usage metrics is available 48-96 hours after online publication and is updated daily on week days.
Initial download of the metrics may take a while.