Fig. 7
Download original image
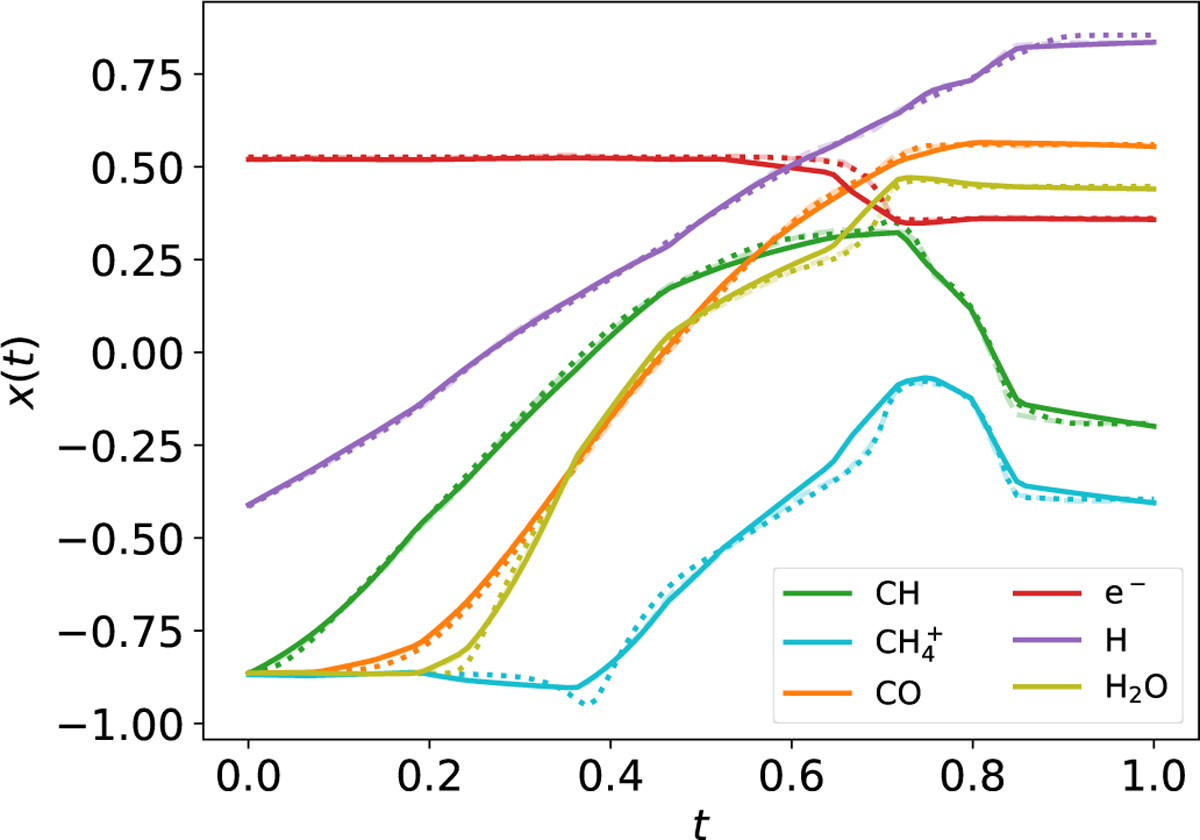
Evolution in time of ![]() for some selected species obtained by integrating the ODE in the physical space
for some selected species obtained by integrating the ODE in the physical space ![]() , (dotted lines, ground truth), by directly autoencoding the original data,
, (dotted lines, ground truth), by directly autoencoding the original data, ![]() , (dashed lines), and by decoding the evolution of
, (dashed lines), and by decoding the evolution of ![]() derived by integrating the ODE system g in the latent space (solid lines). This corresponds to
derived by integrating the ODE system g in the latent space (solid lines). This corresponds to ![]() , where
, where ![]() is represented by the solid lines in Fig. 6). In this plot we report 6 species out of the 29 total.
is represented by the solid lines in Fig. 6). In this plot we report 6 species out of the 29 total.
Current usage metrics show cumulative count of Article Views (full-text article views including HTML views, PDF and ePub downloads, according to the available data) and Abstracts Views on Vision4Press platform.
Data correspond to usage on the plateform after 2015. The current usage metrics is available 48-96 hours after online publication and is updated daily on week days.
Initial download of the metrics may take a while.