Fig. 6
Download original image
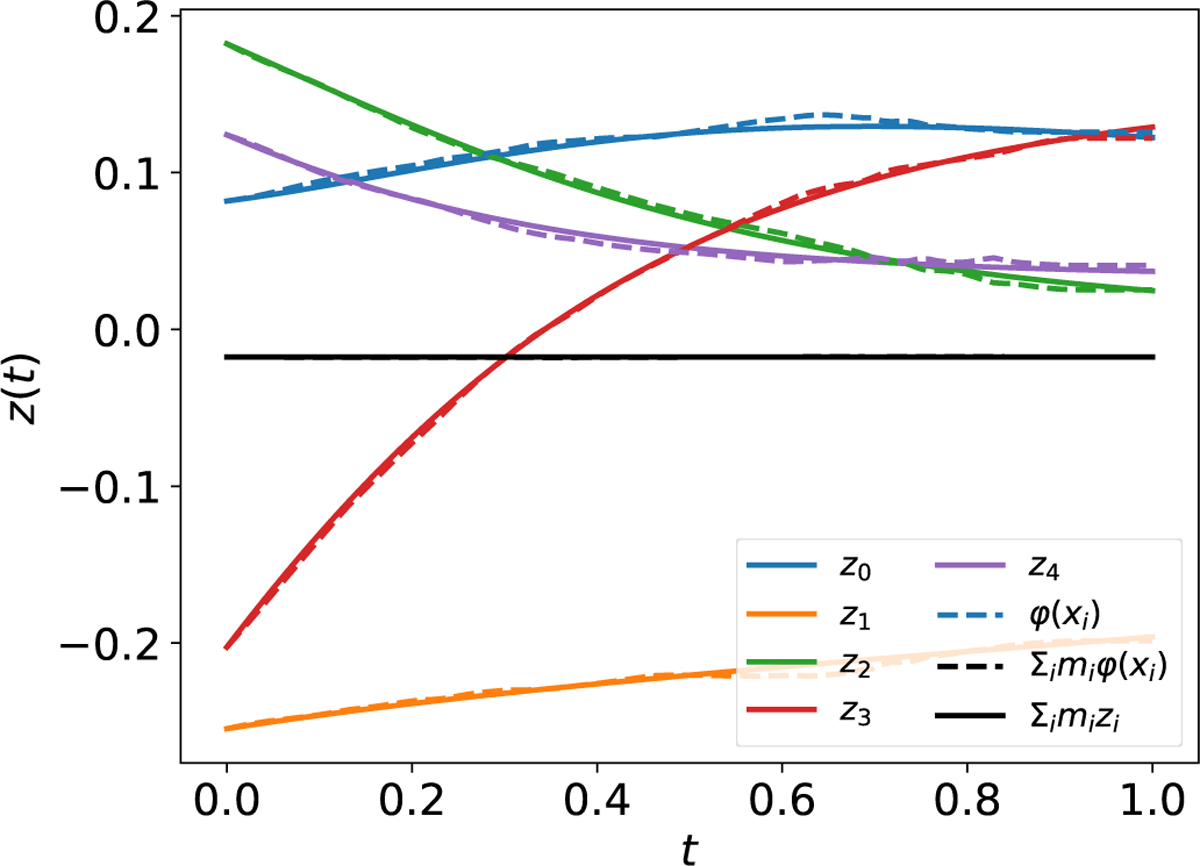
Evolution in time of ![]() obtained by directly encoding the original data, φ(
obtained by directly encoding the original data, φ(![]() ), (dashed lines), and the corresponding evolution obtained by integrating the ODE system g in the latent space starting from
), (dashed lines), and the corresponding evolution obtained by integrating the ODE system g in the latent space starting from ![]() , (solid lines). The different colors represent the 5 latent space variables (the latent "abundances"). The black lines represent the total "mass" in the two cases.
, (solid lines). The different colors represent the 5 latent space variables (the latent "abundances"). The black lines represent the total "mass" in the two cases.
Current usage metrics show cumulative count of Article Views (full-text article views including HTML views, PDF and ePub downloads, according to the available data) and Abstracts Views on Vision4Press platform.
Data correspond to usage on the plateform after 2015. The current usage metrics is available 48-96 hours after online publication and is updated daily on week days.
Initial download of the metrics may take a while.