Fig. 4
Download original image
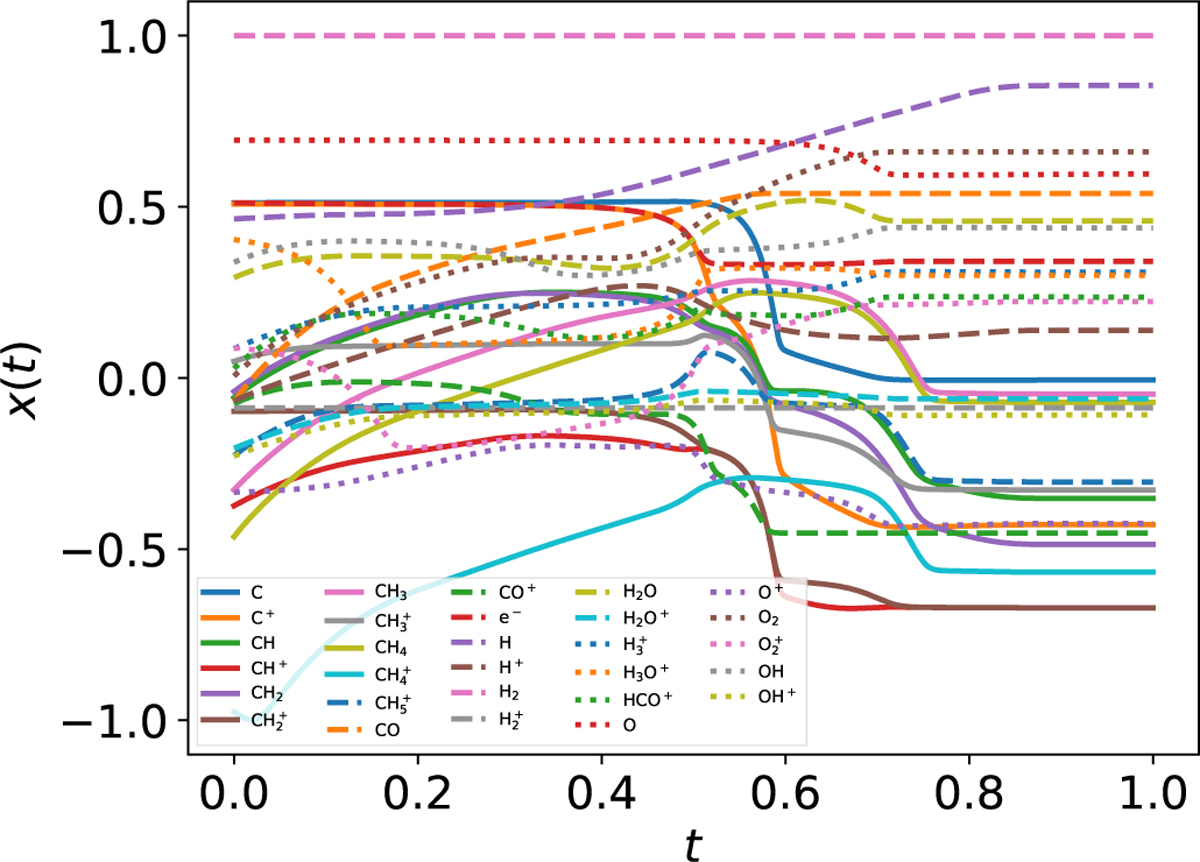
Example of chemical evolution in the physical space obtained by integrating ![]() in time. Each line represents the evolution of each chemical abundance x(t) in time. We note that x = log10(n/cm−3) and normalized in the range [−1,1], while time t = log10(time/yr) and normalized in the range [0,1]. The temporal grid consists of 100 uniformly spaced points (in logarithmic time).
in time. Each line represents the evolution of each chemical abundance x(t) in time. We note that x = log10(n/cm−3) and normalized in the range [−1,1], while time t = log10(time/yr) and normalized in the range [0,1]. The temporal grid consists of 100 uniformly spaced points (in logarithmic time).
Current usage metrics show cumulative count of Article Views (full-text article views including HTML views, PDF and ePub downloads, according to the available data) and Abstracts Views on Vision4Press platform.
Data correspond to usage on the plateform after 2015. The current usage metrics is available 48-96 hours after online publication and is updated daily on week days.
Initial download of the metrics may take a while.