Fig. 2
Download original image
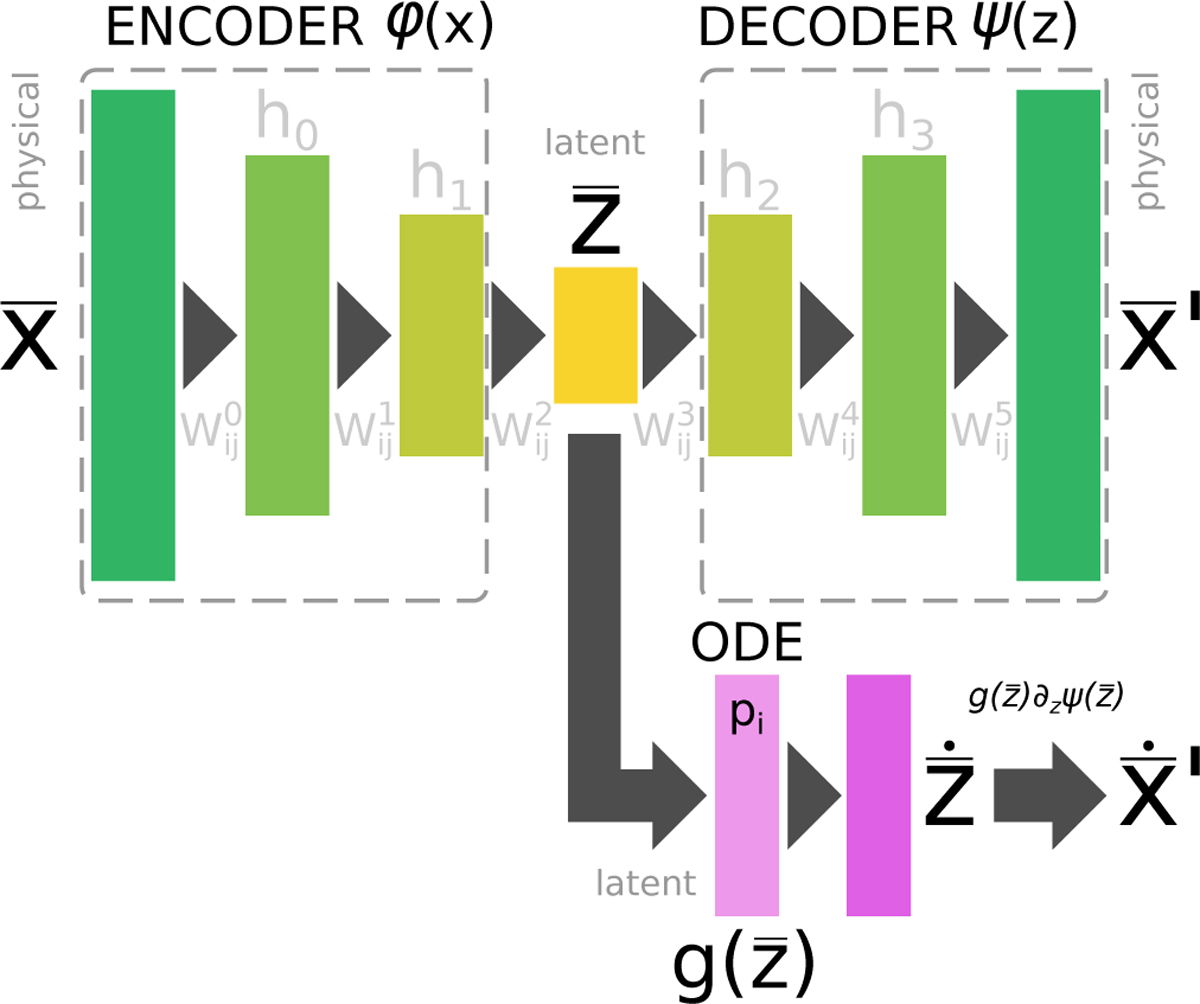
Schematic of the autoencoder and latent ODE system. The upper part of the sketch represents the autoencoder, with both encoder and decoder deep neural networks. Each rectangle represents a layer of the deep neural network, linked together by weights W and biases b (omitted for the sake of clarity). The input to the encoder is ![]() , with N nodes (dimensions), connected to a sequence of hidden layers hi with decreasing dimensionality/number of nodes, until reaching the layer
, with N nodes (dimensions), connected to a sequence of hidden layers hi with decreasing dimensionality/number of nodes, until reaching the layer ![]() with M nodes (dimensions), where the maximum compression is obtained. The decoder is symmetric w.r.t. the encoder, with layers of increasing dimensionality, ending with an output layer of N nodes (dimensions). We note that, in our case, we have six hidden layers instead of the 4 shown in this sketch. In the lower part of the sketch, we show the latent ODE system that uses
with M nodes (dimensions), where the maximum compression is obtained. The decoder is symmetric w.r.t. the encoder, with layers of increasing dimensionality, ending with an output layer of N nodes (dimensions). We note that, in our case, we have six hidden layers instead of the 4 shown in this sketch. In the lower part of the sketch, we show the latent ODE system that uses ![]() as inputs and produces
as inputs and produces ![]() as output, both with M dimensions. This additional neural network is controlled by the parameters p (one for each latent reaction), and has an analytical representation
as output, both with M dimensions. This additional neural network is controlled by the parameters p (one for each latent reaction), and has an analytical representation ![]() . The obtained latent space derivatives are decoded to the target derivatives
. The obtained latent space derivatives are decoded to the target derivatives ![]() with the same procedure as of Eq. (5).
with the same procedure as of Eq. (5).
Current usage metrics show cumulative count of Article Views (full-text article views including HTML views, PDF and ePub downloads, according to the available data) and Abstracts Views on Vision4Press platform.
Data correspond to usage on the plateform after 2015. The current usage metrics is available 48-96 hours after online publication and is updated daily on week days.
Initial download of the metrics may take a while.