Fig. F.1
Download original image
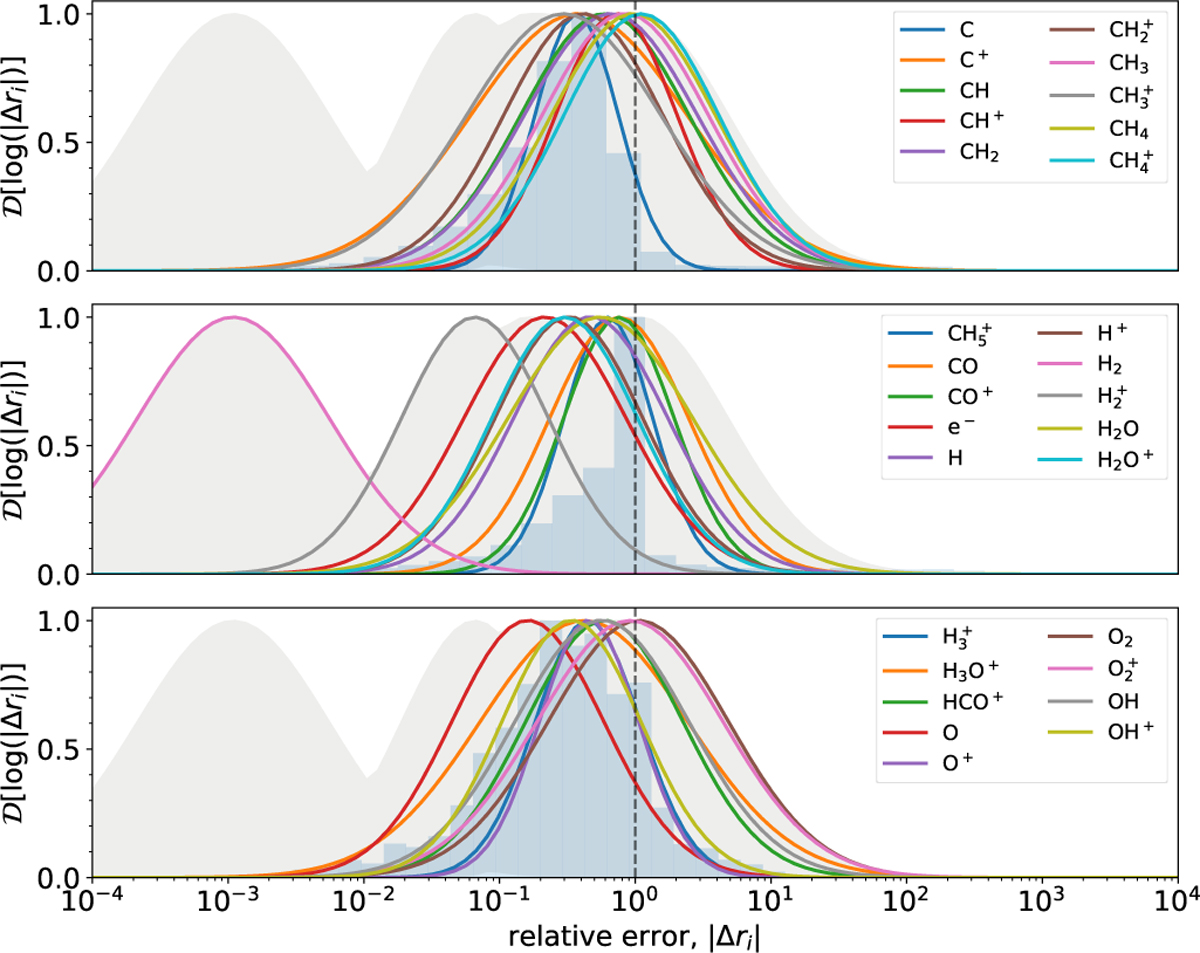
Gaussian fitting functions of the logarithm of the relative error distributions for each chemical species. For three selected species (C, ![]() , and
, and ![]() ) we also report the normalized histogram of the error counts (light blue bars). The vertical dashed line indicates a relative error of 1 . The plotted distributions are normalized to the maximum. As a reference, the gray-shaded area is the envelope of all the curves. See also Tab. F.1.
) we also report the normalized histogram of the error counts (light blue bars). The vertical dashed line indicates a relative error of 1 . The plotted distributions are normalized to the maximum. As a reference, the gray-shaded area is the envelope of all the curves. See also Tab. F.1.
Current usage metrics show cumulative count of Article Views (full-text article views including HTML views, PDF and ePub downloads, according to the available data) and Abstracts Views on Vision4Press platform.
Data correspond to usage on the plateform after 2015. The current usage metrics is available 48-96 hours after online publication and is updated daily on week days.
Initial download of the metrics may take a while.