Fig. D.1
Download original image
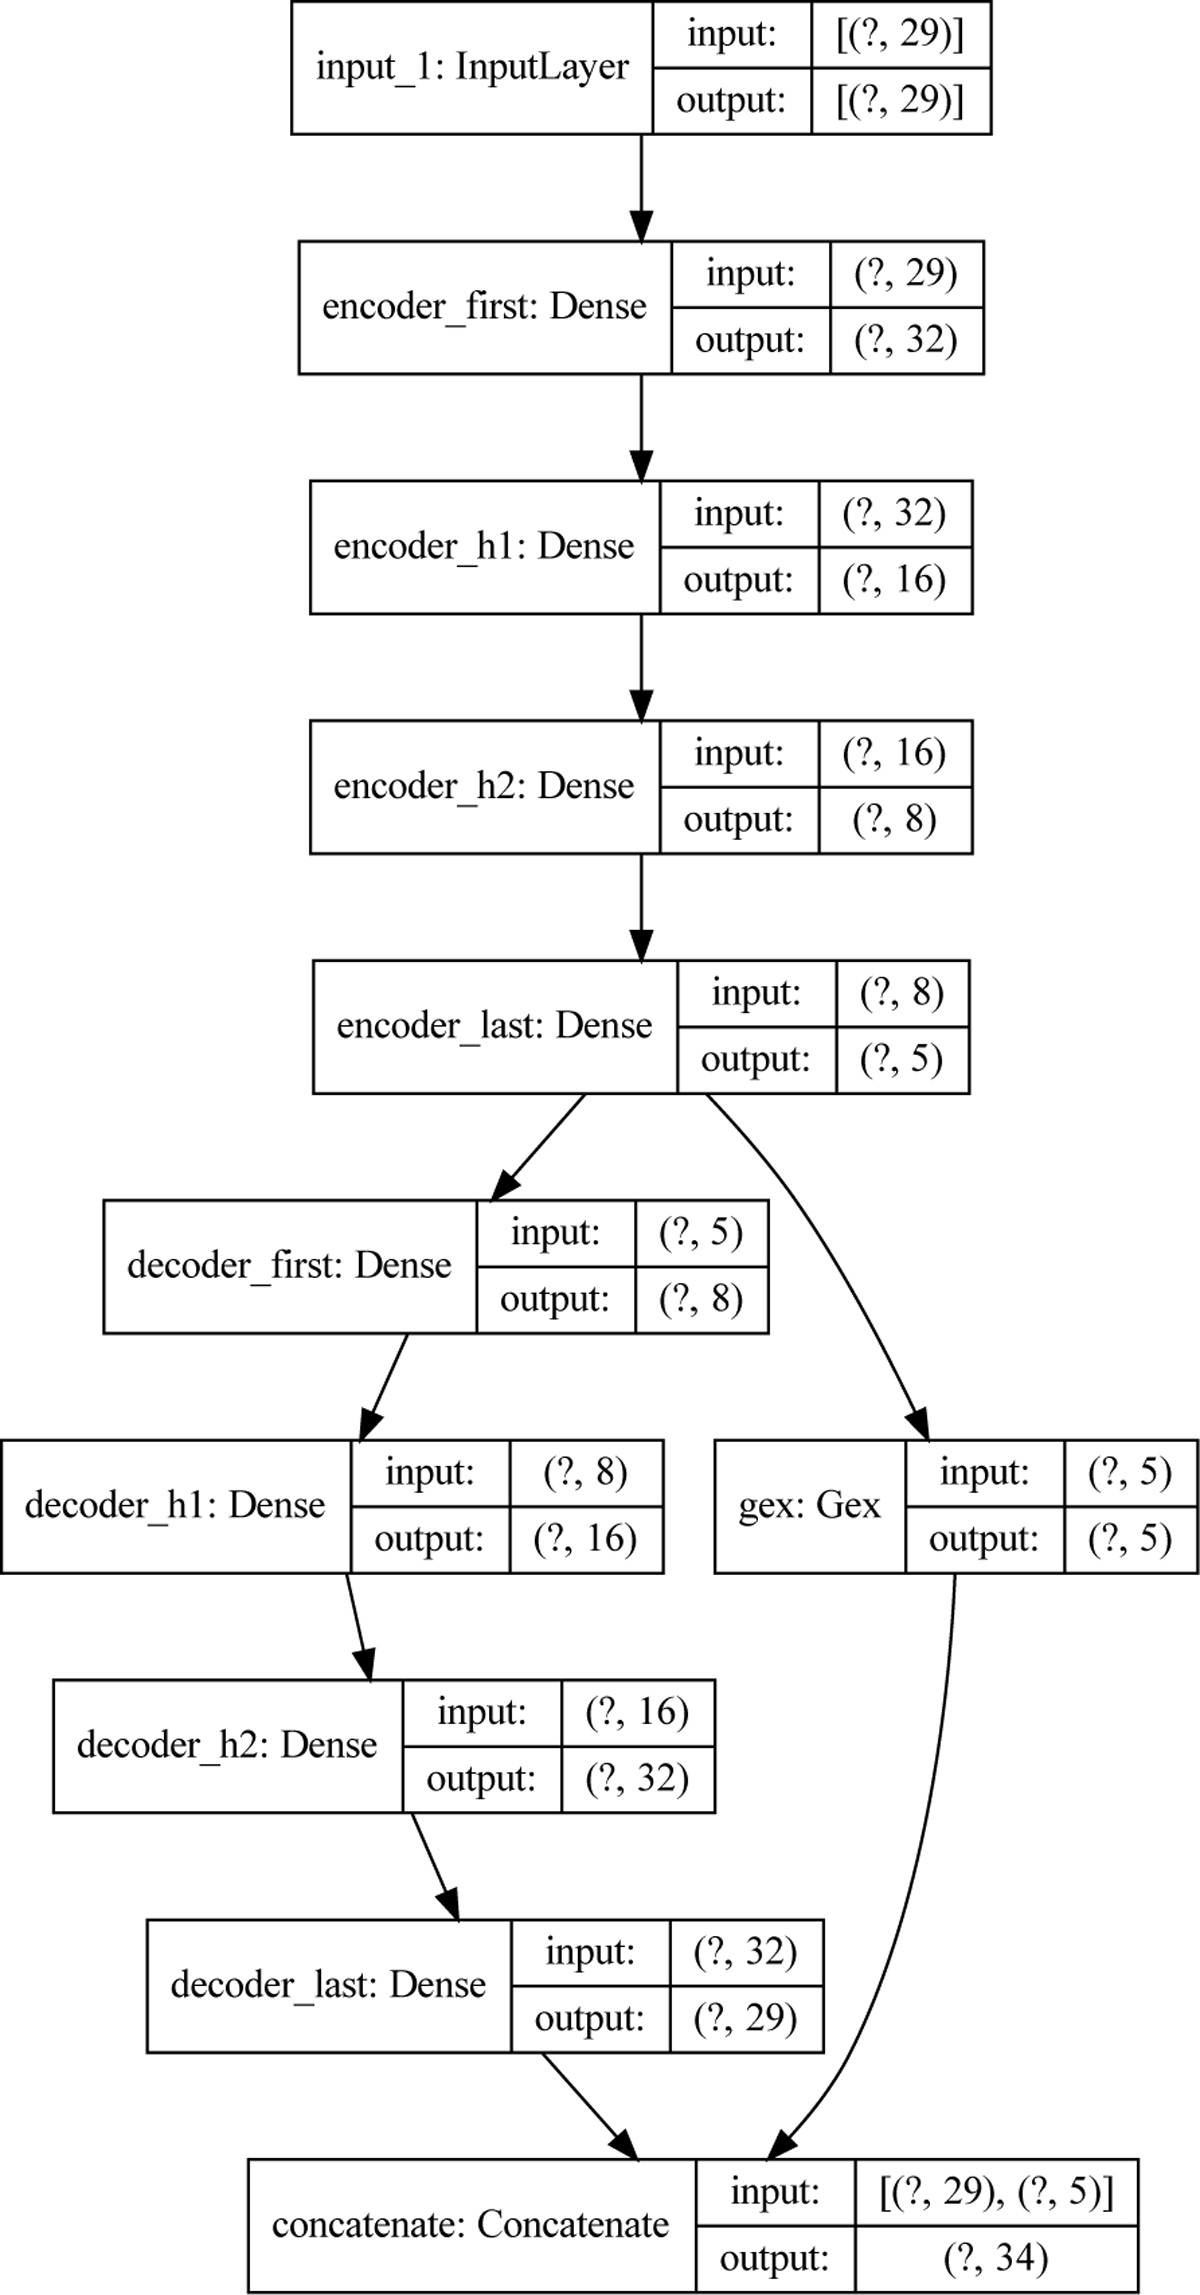
Model layout from the plot_model utility in KERAS. The upper part represents the encoder, the left branch the decoder, and the right the custom layer gex (g). The output of encoder_last is the latent space ![]() . Concatenate is a dummy layer that concatenates the output of the two branches. The question marks indicate the unknown batch size, that is defined at runtime. To be compared with Fig. 2.
. Concatenate is a dummy layer that concatenates the output of the two branches. The question marks indicate the unknown batch size, that is defined at runtime. To be compared with Fig. 2.
Current usage metrics show cumulative count of Article Views (full-text article views including HTML views, PDF and ePub downloads, according to the available data) and Abstracts Views on Vision4Press platform.
Data correspond to usage on the plateform after 2015. The current usage metrics is available 48-96 hours after online publication and is updated daily on week days.
Initial download of the metrics may take a while.