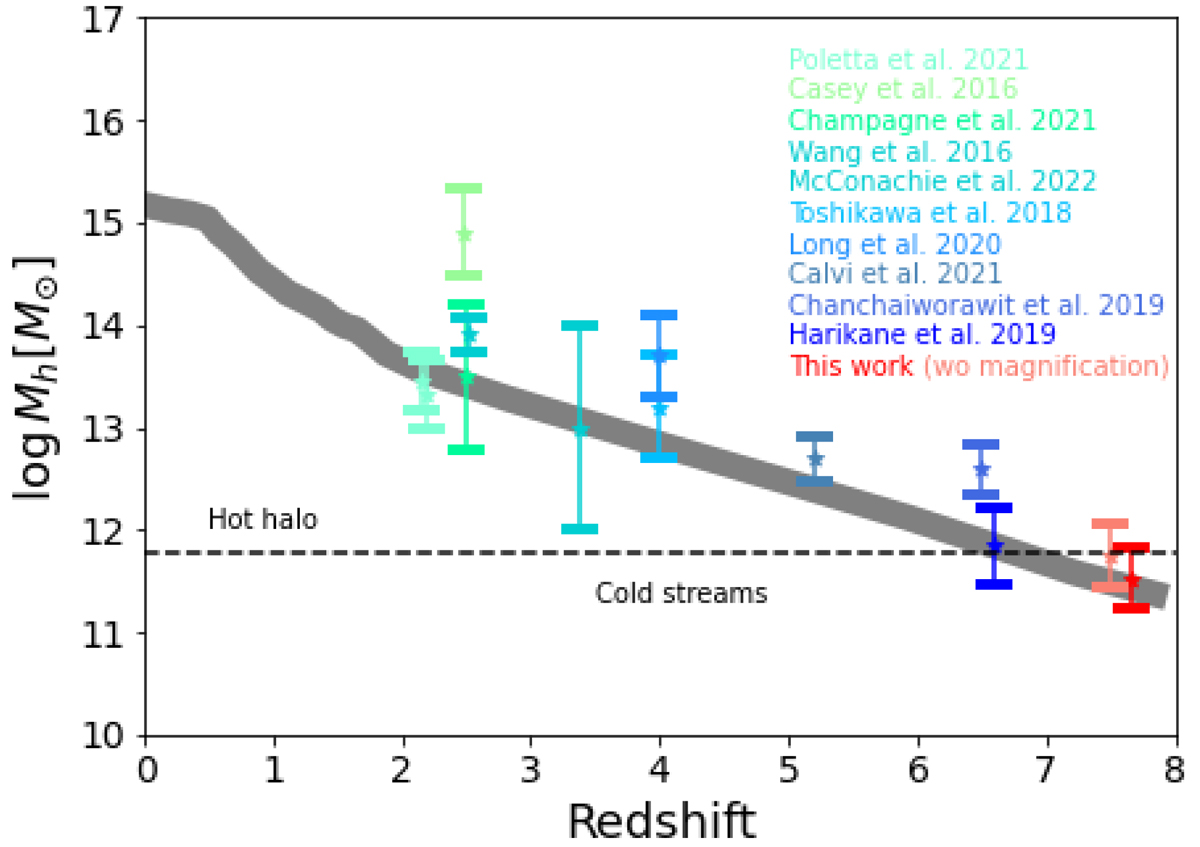
Fig. 6.
Download original image
Evolution of protocluster halo mass as a function of redshift. The grey shaded region displays the expected halo mass evolution of a Coma-like cluster (from Chiang et al. 2013) assuming a smooth evolution above z ≥ 7. The dashed line shows the typical threshold mass for a stable shock in a spherical infall, below which the flows are predominantly cold and above which a shock-heated medium is present (from Dekel & Birnboim 2006). Overplotted are the halo mass of recently studied protoclusters at z ≥ 2 from Polletta et al. (2021), Casey (2016), Champagne et al. (2021), Wang et al. (2016), McConachie et al. (2022), Toshikawa et al. (2018), Long et al. (2020), Calvi et al. (2021), Chanchaiworawit et al. (2019), and Harikane et al. (2019). Our halo mass estimate (red dot, the sum of halo masses of individual members) is fully consistent with that expected for a Coma-like cluster. The pink point shows the total halo mass without accounting for magnification (shifted to slightly lower redshift for purposes of clarity).
Current usage metrics show cumulative count of Article Views (full-text article views including HTML views, PDF and ePub downloads, according to the available data) and Abstracts Views on Vision4Press platform.
Data correspond to usage on the plateform after 2015. The current usage metrics is available 48-96 hours after online publication and is updated daily on week days.
Initial download of the metrics may take a while.