Fig. B.1
Download original image
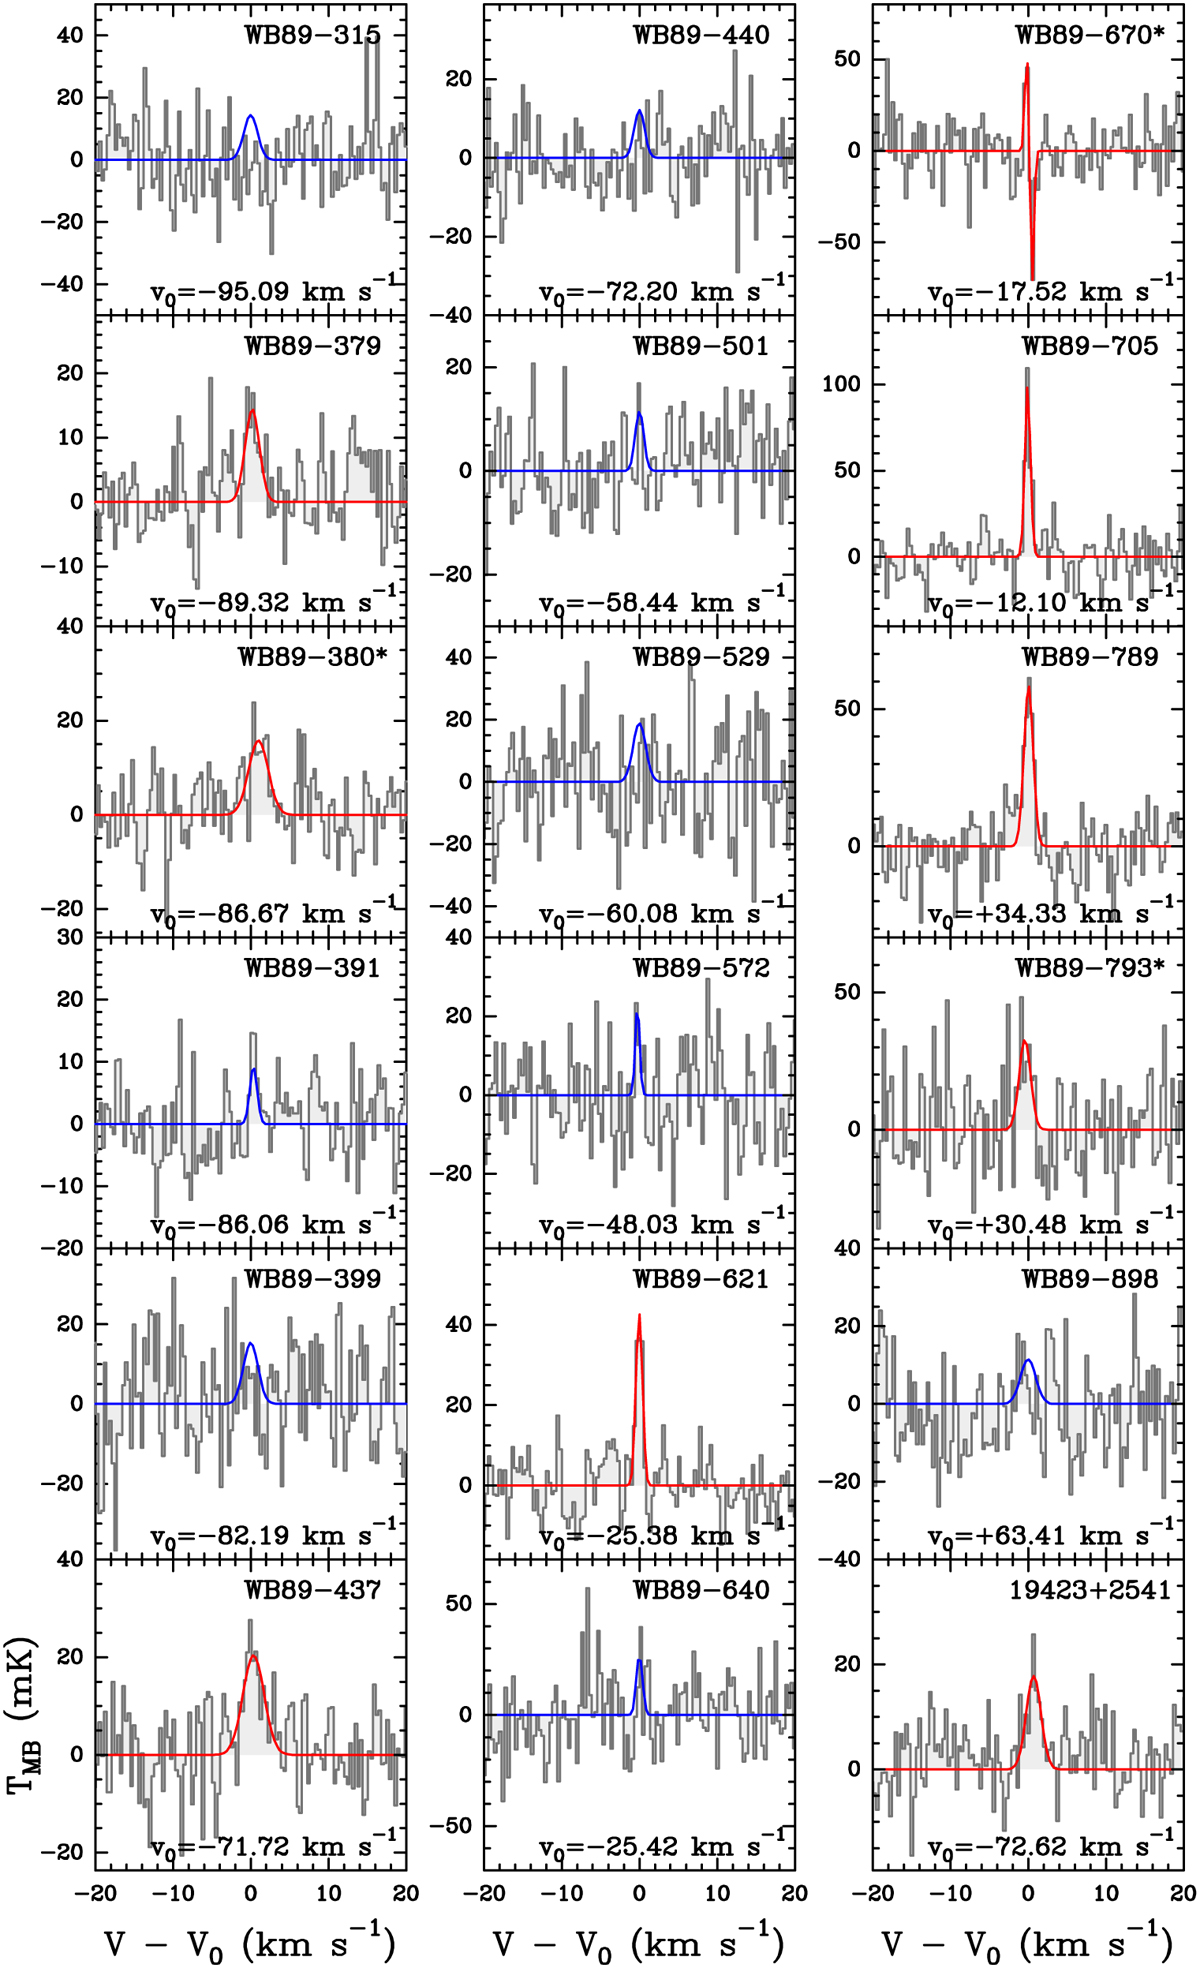
Spectra of HN13C(1–0) obtained for the sample of sources. For each spectrum the x axis represents a velocity interval of ±20 km s−1 around the velocity, v0, obtained from H2CO observations by Blair et al. (2008). The y axis shows the intensity in main beam temperature units. The red curves are the best LTE fits obtained with MADCUBA for detections and tentative detections (indicated with an asterisk in the source name). The blue curves correspond to the upper limits obtained for non-detections.
Current usage metrics show cumulative count of Article Views (full-text article views including HTML views, PDF and ePub downloads, according to the available data) and Abstracts Views on Vision4Press platform.
Data correspond to usage on the plateform after 2015. The current usage metrics is available 48-96 hours after online publication and is updated daily on week days.
Initial download of the metrics may take a while.