Fig. 1
Download original image
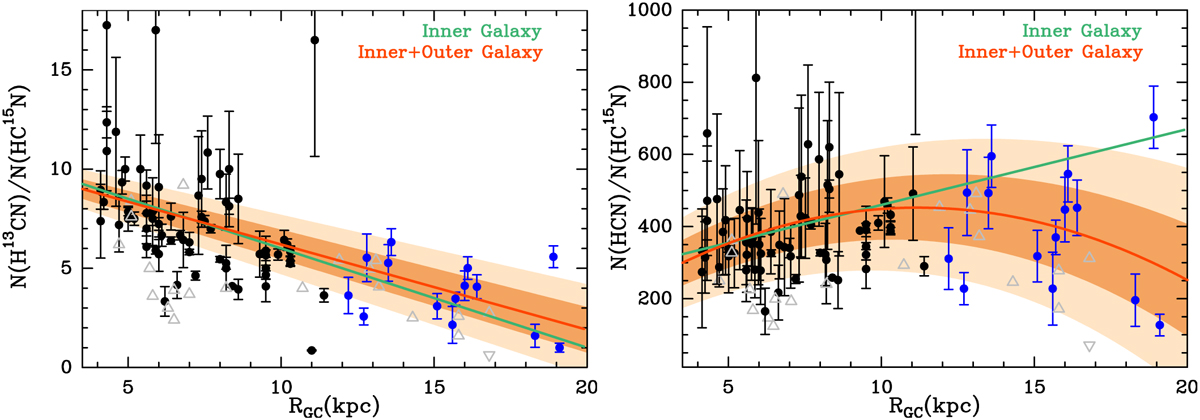
Isotopic ratios versus galactocentric distance. Left panel: H13CN/HC15N ratio as a function of the galactocentric distance, RGC. The solid red line is the linear regression fit obtained using the whole sample, along with its 0.5 and 1σ uncertainty (dark and light orange regions, respectively). Right panel: same as the left panel but for the 14N/15N ratio of HCN. The solid red parabola is obtained from the analysis of the data, as explained in Sect. 3.3, along with its 0.5 and 1σ uncertainty (dark and light orange regions, respectively). In both panels the solid green line represents the linear trend found in the inner Galaxy by Colzi et al. (2018b) and extrapolated up to 20 kpc. Black points represent the values obtained in the inner Galaxy by Colzi et al. (2018b), and blue points are the values obtained in this work towards the outer Galaxy. Grey triangles pointing upwards are lower limits, while those pointing downwards are upper limits. Note that the source at RGC = 2.1 kpc from Colzi et al. (2018b) has been used for the analysis but is not shown in this plot for visualisation purposes.
Current usage metrics show cumulative count of Article Views (full-text article views including HTML views, PDF and ePub downloads, according to the available data) and Abstracts Views on Vision4Press platform.
Data correspond to usage on the plateform after 2015. The current usage metrics is available 48-96 hours after online publication and is updated daily on week days.
Initial download of the metrics may take a while.