Fig. A.1.
Download original image
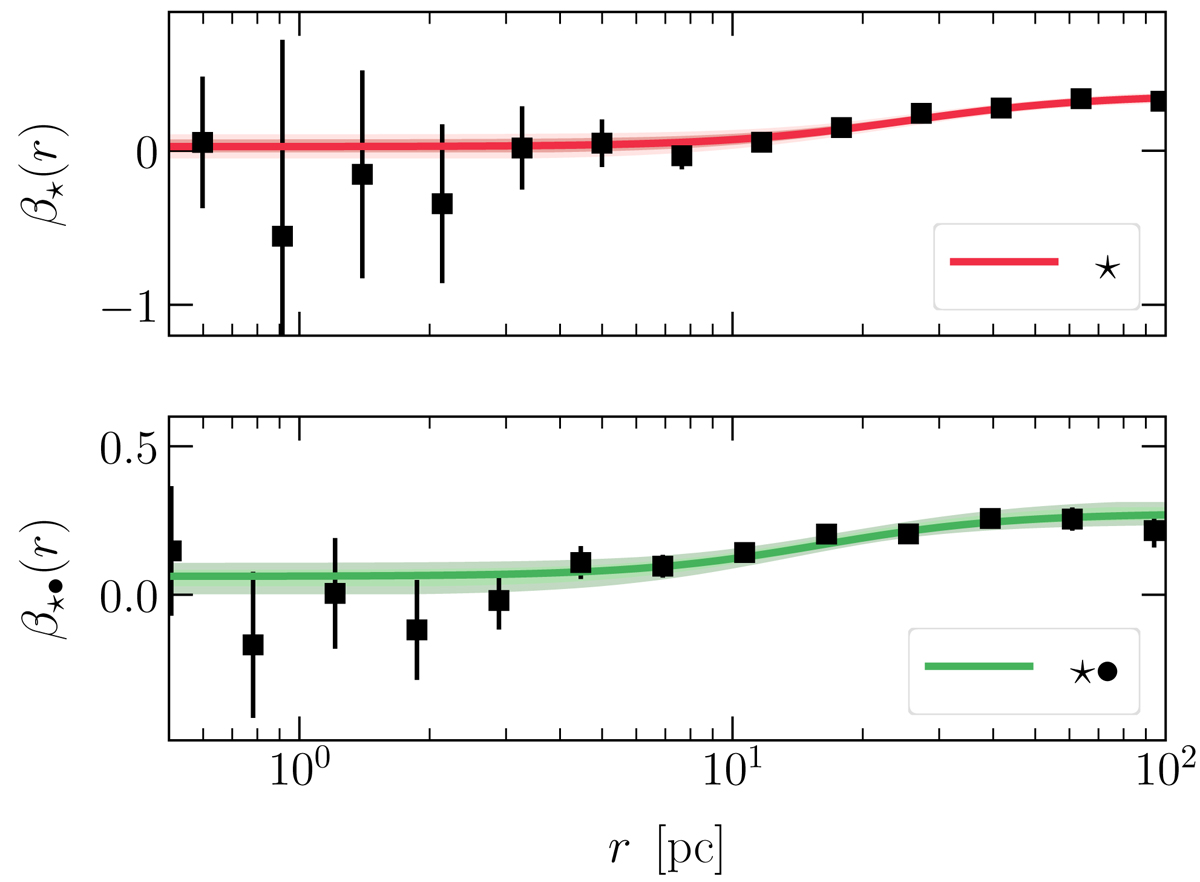
Goodness of fit: Bayesian fit of the velocity anisotropy with BALROGO. The upper plot shows the case without a dark matter mini-halo, while the lower plot shows the case with a dark matter mini-halo. The black dots are the binned values of the empirical velocity anisotropy, logarithmically spaced and with error bars representing the 3-σ Poisson error. The solid coloured line (red or green) represent the best likelihood fit of the Osipkov (1979), Merritt (1985) model (Eq. [2]), with respective shaded regions encompassing the [2.5, 97.5] percentiles of the fit.
Current usage metrics show cumulative count of Article Views (full-text article views including HTML views, PDF and ePub downloads, according to the available data) and Abstracts Views on Vision4Press platform.
Data correspond to usage on the plateform after 2015. The current usage metrics is available 48-96 hours after online publication and is updated daily on week days.
Initial download of the metrics may take a while.