Fig. 9
Download original image
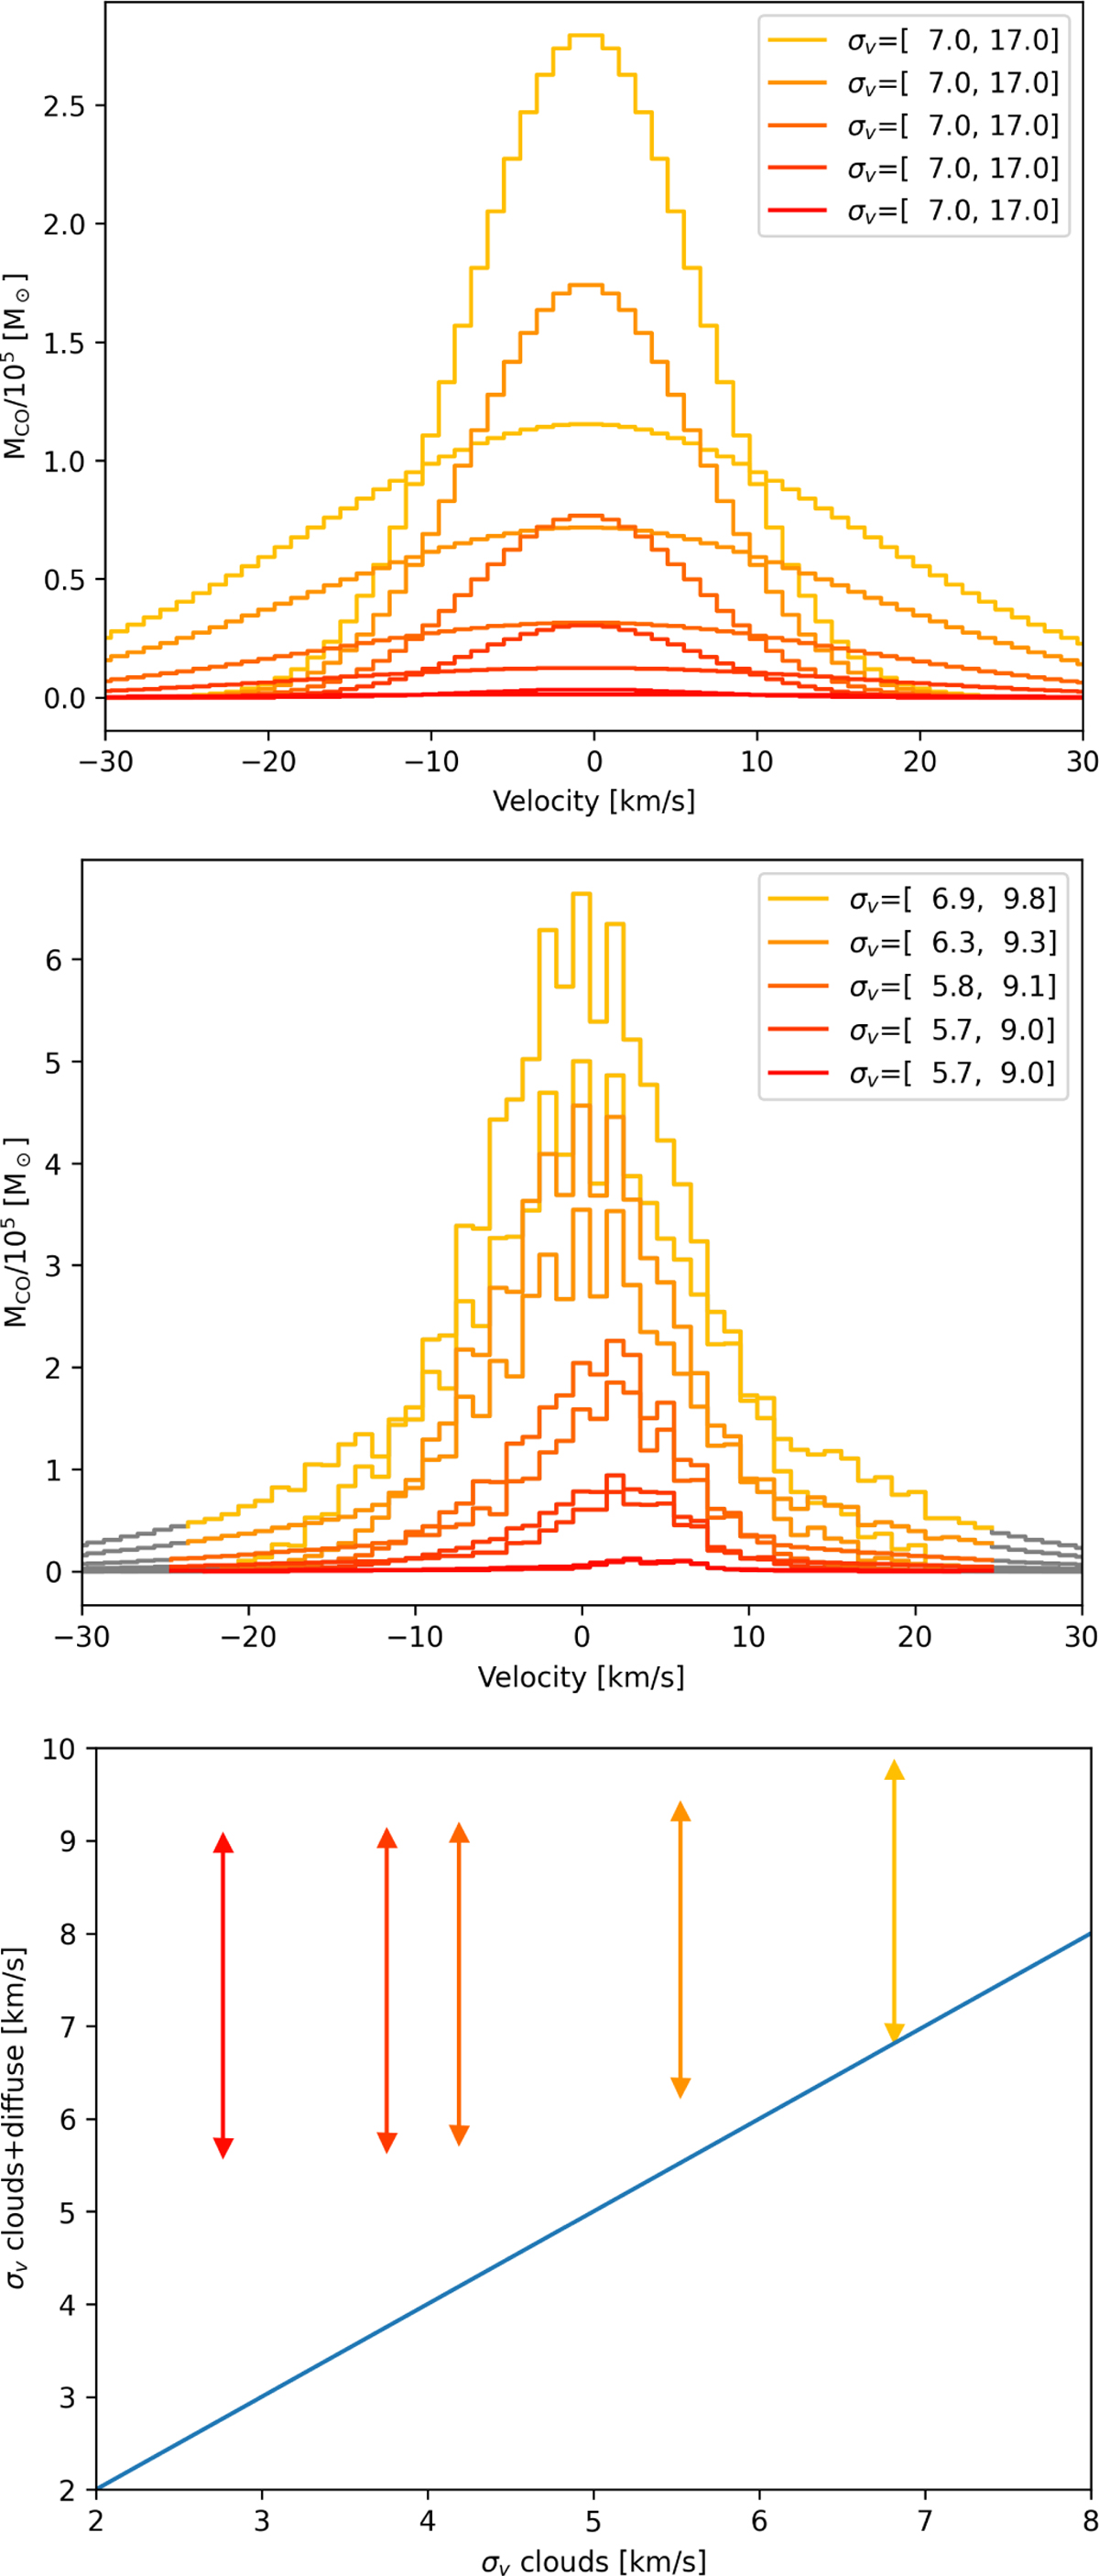
CO velocity distributions for Sun-centred apertures of various sizes, with standard deviations noted in the legends. Top: estimated spectra for the diffuse component in the survey area, with a minimum and maximum velocity dispersion. Middle: combination of the two, how they would look if observed together. The grey lines show what we estimate as the observation threshold (see main text), and we estimate the velocity standard deviations above this baseline. Bottom: standard deviations of the apertures containing the clouds alone vs the estimated total spectra. The blue line corresponds to a one-to-one relation.
Current usage metrics show cumulative count of Article Views (full-text article views including HTML views, PDF and ePub downloads, according to the available data) and Abstracts Views on Vision4Press platform.
Data correspond to usage on the plateform after 2015. The current usage metrics is available 48-96 hours after online publication and is updated daily on week days.
Initial download of the metrics may take a while.