Fig. 4
Download original image
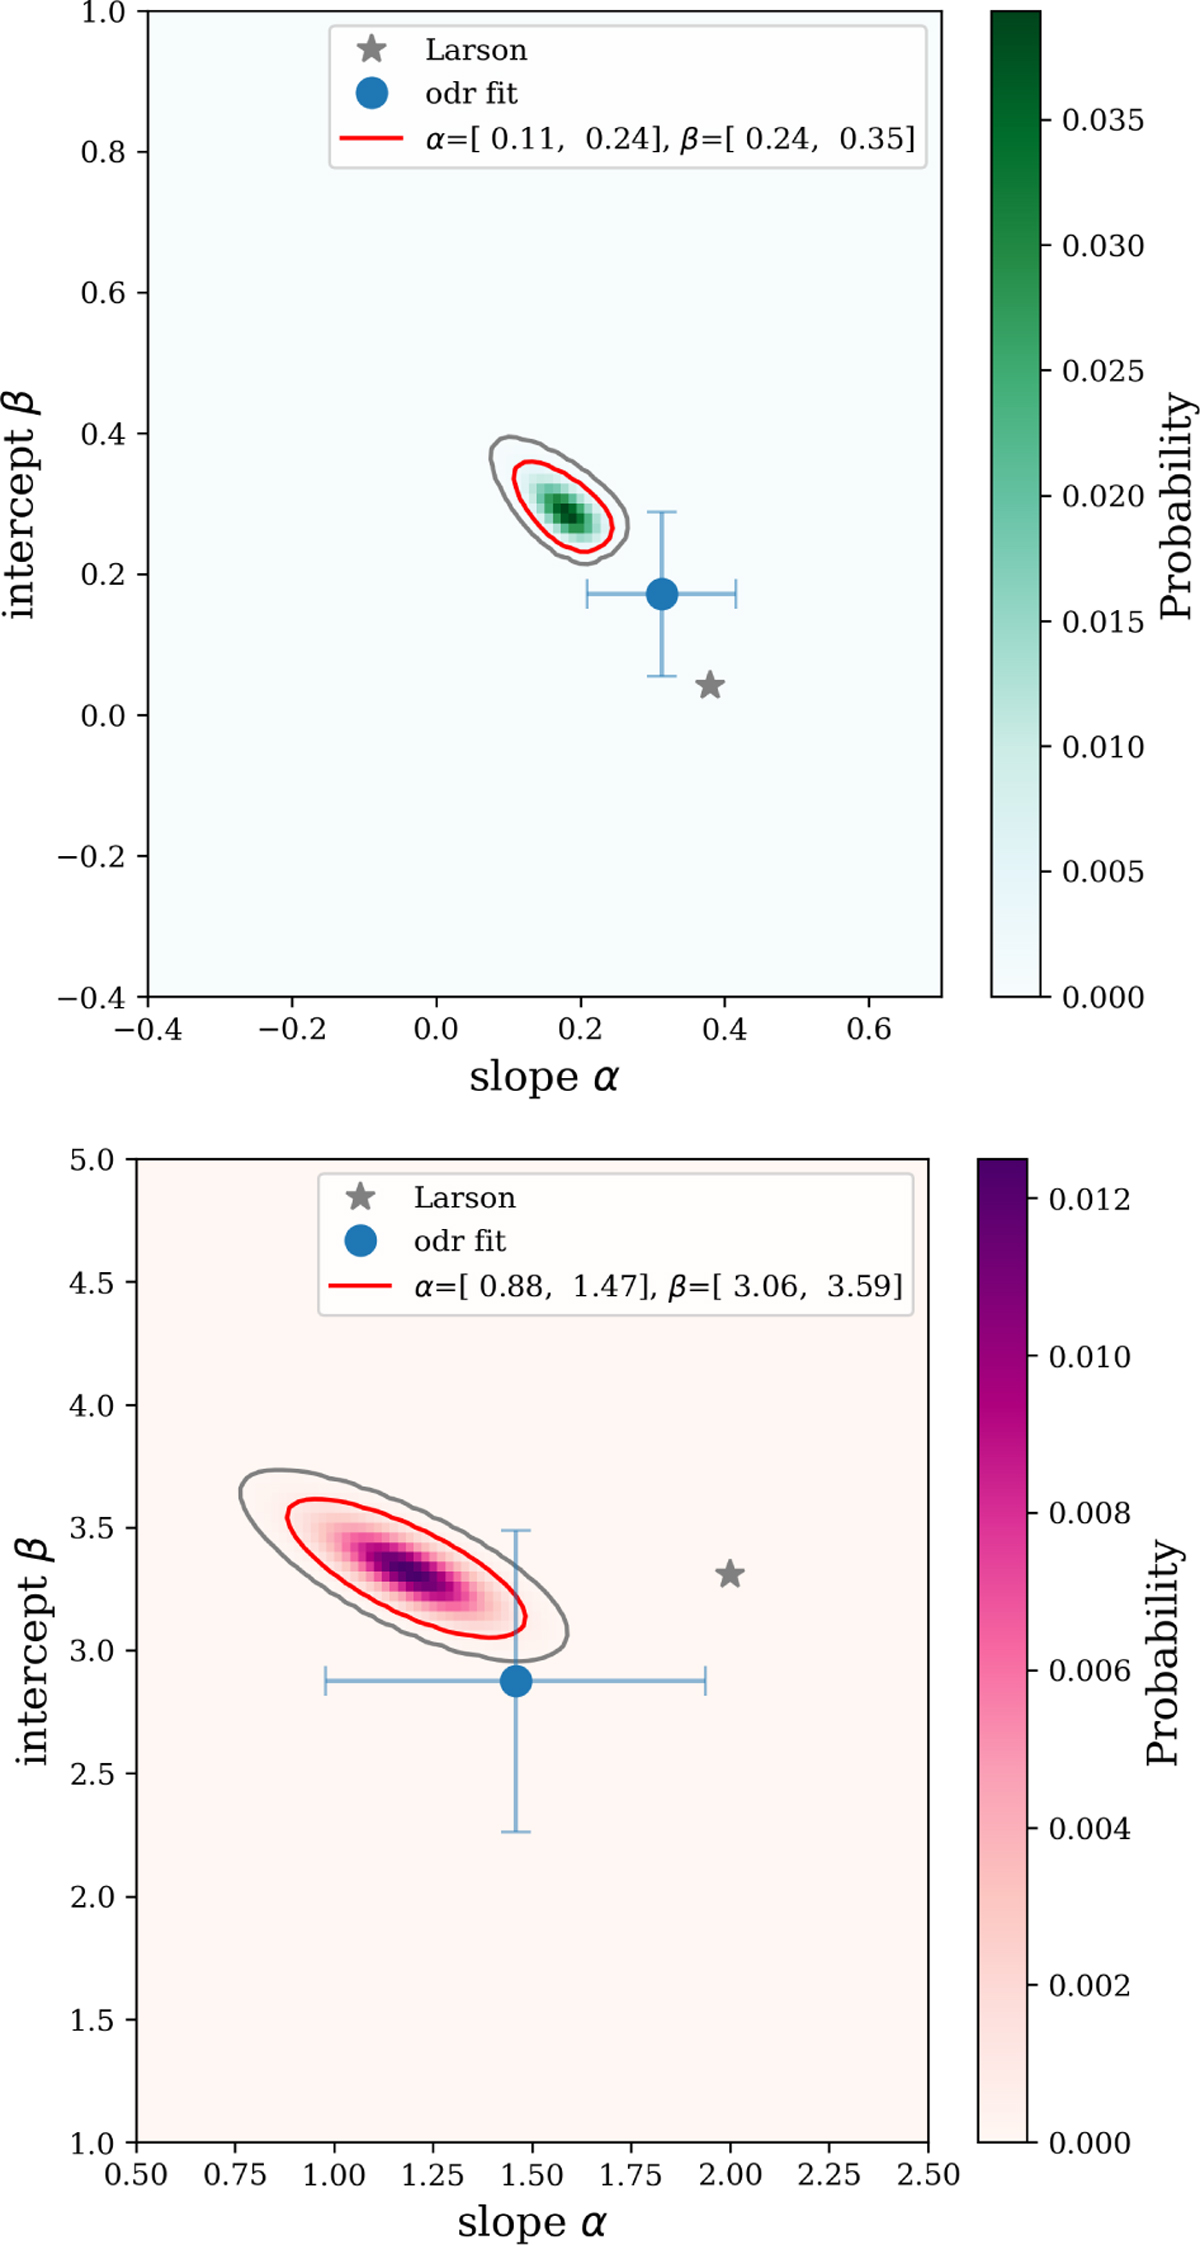
Probability maps in gradient-intercept space for linewidth-size relation (top) and mass-size relation (bottom), assuming a probability of one that the parameters are within the ranges of the plot. The original Larson (1981) fits are denoted by a grey star, and the fits from Fig. 3 are denoted by a blue circle. The 95% confidence intervals are encircled in red, and the 99.7% confidence intervals are presented in grey.
Current usage metrics show cumulative count of Article Views (full-text article views including HTML views, PDF and ePub downloads, according to the available data) and Abstracts Views on Vision4Press platform.
Data correspond to usage on the plateform after 2015. The current usage metrics is available 48-96 hours after online publication and is updated daily on week days.
Initial download of the metrics may take a while.