Fig. 3
Download original image
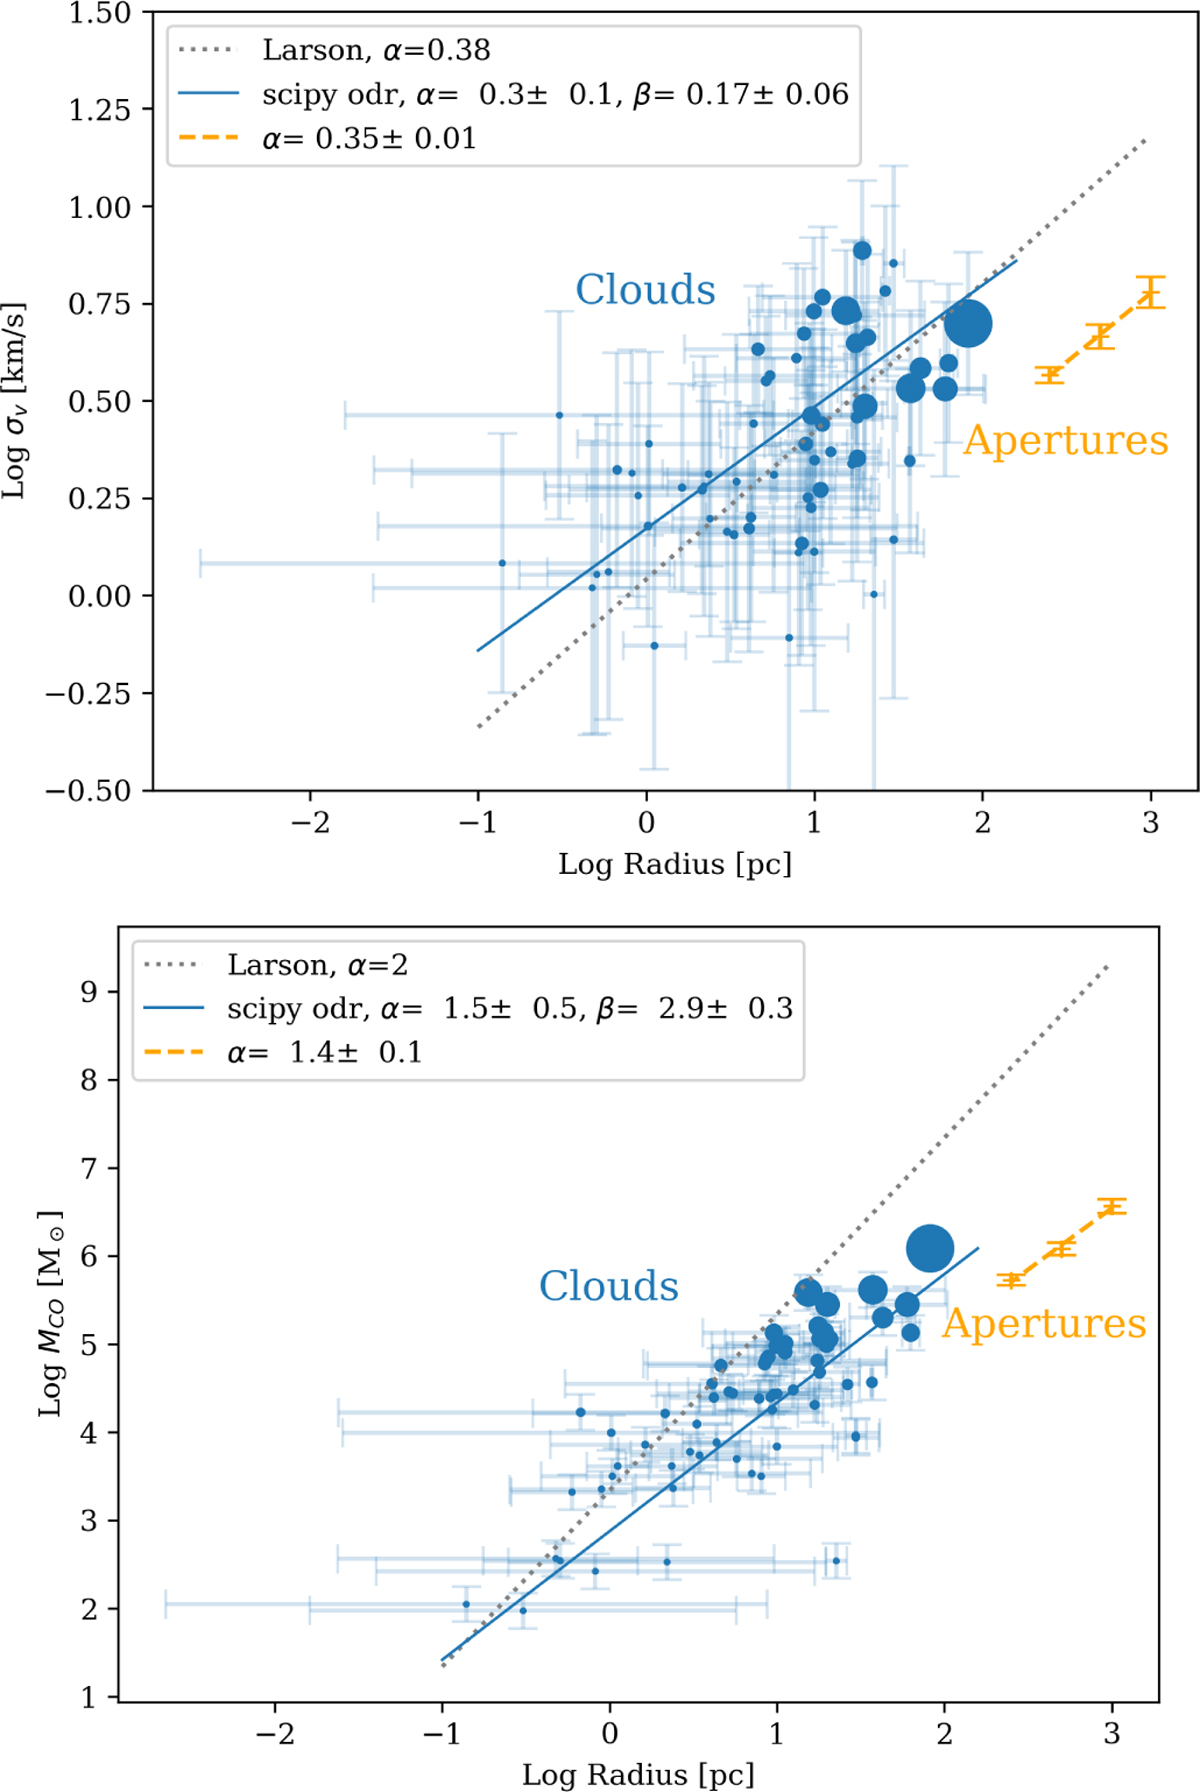
Linewidth-size (top) and mass-size (bottom) relations for the clouds and apertures. Clouds are shown in blue, and the symbol size is proportional to the cloud mass. The error bars are as described in Sect. 2.3. Apertures are shown in orange, with error bars indicating the standard deviation between the apertures. The solid blue line shows a fit to the cloud data, the dashed orange line shows a fit to the aperture data, and the dotted grey line shows the fit from Larson (1981).
Current usage metrics show cumulative count of Article Views (full-text article views including HTML views, PDF and ePub downloads, according to the available data) and Abstracts Views on Vision4Press platform.
Data correspond to usage on the plateform after 2015. The current usage metrics is available 48-96 hours after online publication and is updated daily on week days.
Initial download of the metrics may take a while.