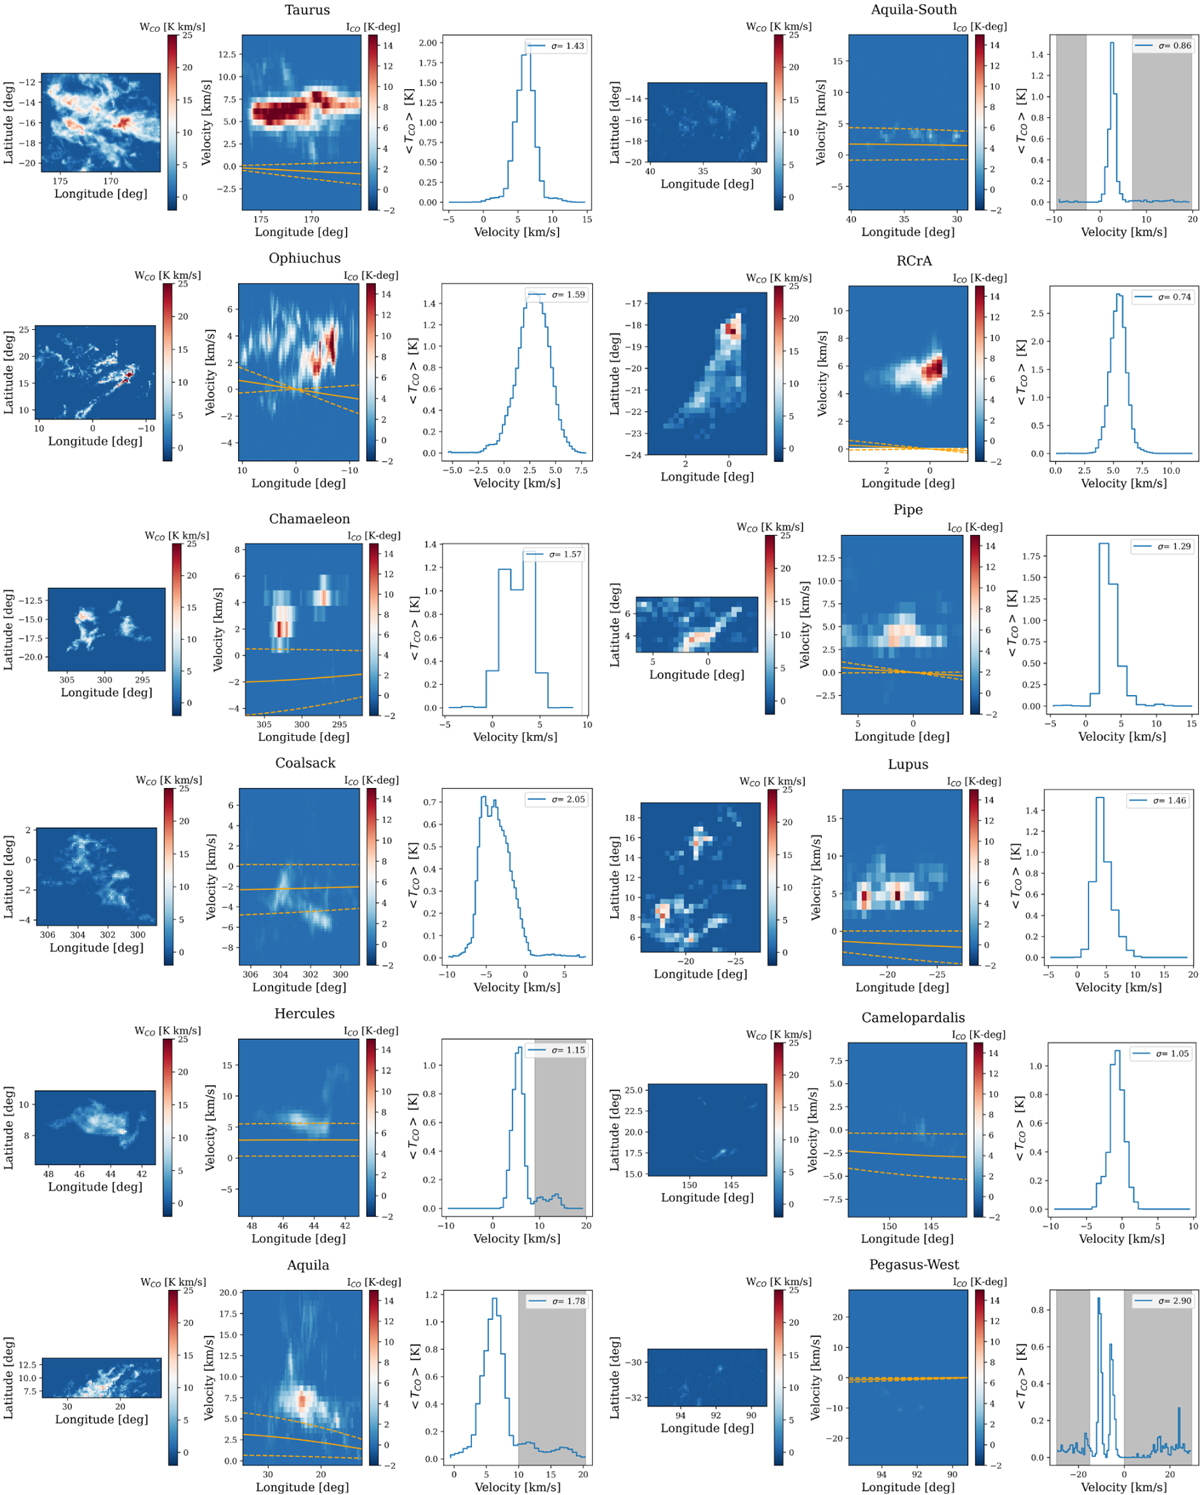
Fig. B.1
Download original image
Overview of the PPV data of the molecular clouds in our sample, seen in CO position and velocity from Dame et al. (2001). The grey regions of the spectra show the regions that were masked out of the analysis, as they do not seem to be associated with the main cloud. The solid orange line in velocity space shows the estimated disk velocity at the cloud distance, which was subtracted from the original spectra.
Current usage metrics show cumulative count of Article Views (full-text article views including HTML views, PDF and ePub downloads, according to the available data) and Abstracts Views on Vision4Press platform.
Data correspond to usage on the plateform after 2015. The current usage metrics is available 48-96 hours after online publication and is updated daily on week days.
Initial download of the metrics may take a while.