Fig. 1
Download original image
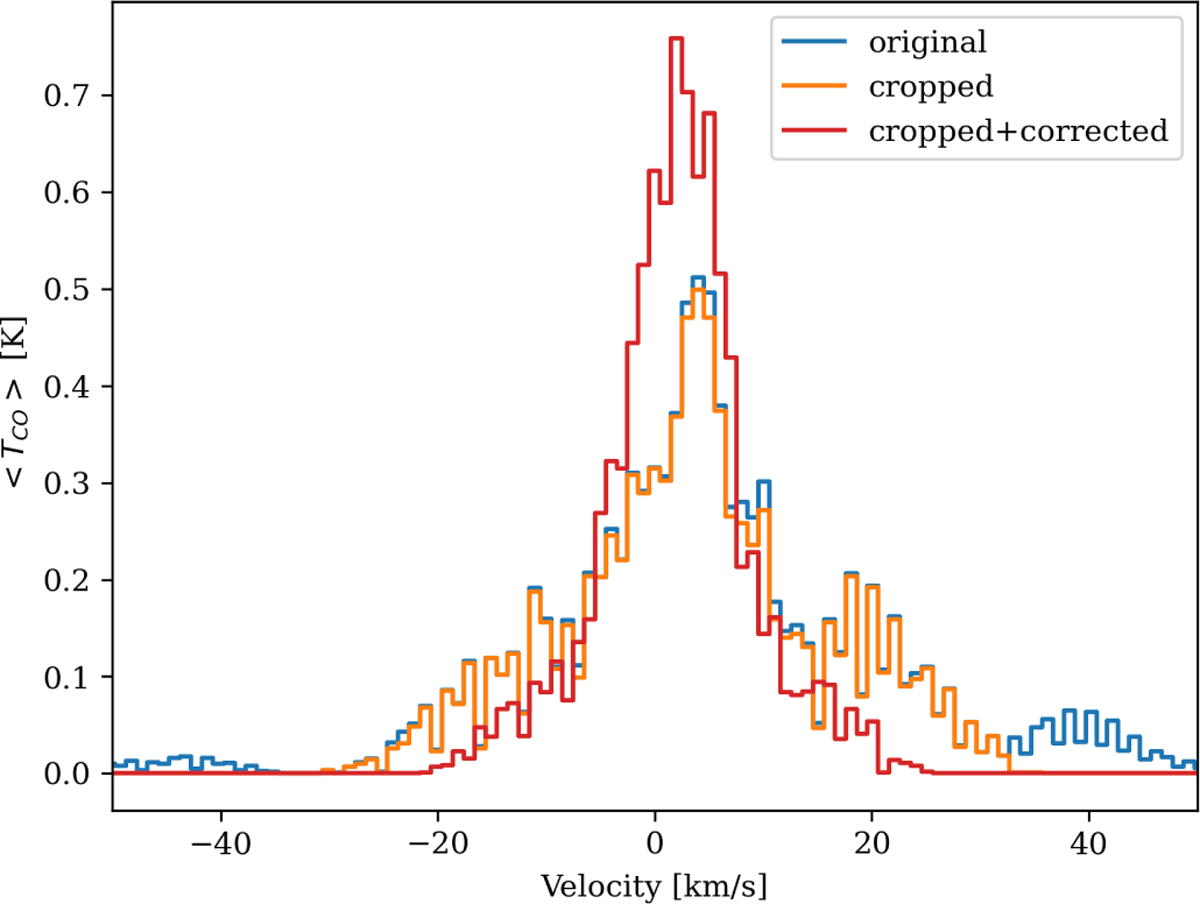
Total CO spectrum of the molecular clouds within a distance of 2 kpc. The original spectrum before any corrections is shown in blue, the spectrum after the cropping of the clouds is shown in orange, and the final spectrum with cropped spectra and subtracted disk velocity is shown in red. The same spectra in mass units are shown in Fig. C.1.
Current usage metrics show cumulative count of Article Views (full-text article views including HTML views, PDF and ePub downloads, according to the available data) and Abstracts Views on Vision4Press platform.
Data correspond to usage on the plateform after 2015. The current usage metrics is available 48-96 hours after online publication and is updated daily on week days.
Initial download of the metrics may take a while.