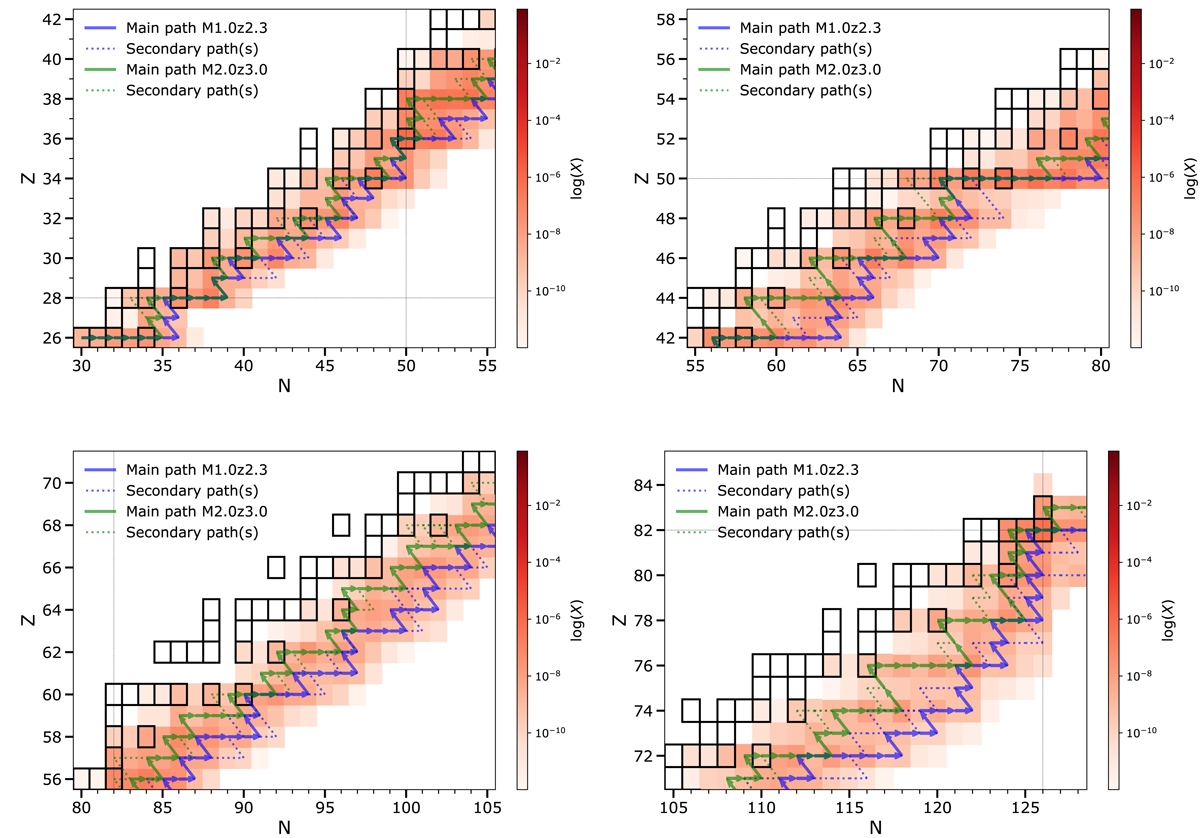
Fig. 9.
Download original image
Main i-process path (starting from 56Fe) in the M1.0z2.3 (blue arrows) and M2.0z3.0 model (green arrows), at the bottom of the pulse, at the time of maximum neutron density (Nn = 2.19 × 10¹⁵ and 6.76 × 1013 cm−3, respectively). The dashed lines show the secondary paths, where at least 30% of the total flux goes. The four panels corresponds to four different zones in the (N, Z) plane. The black squares highlight the stable nuclei. The abundances of the M1.0z2.3 model are shown by the red colour scale in mass fraction.
Current usage metrics show cumulative count of Article Views (full-text article views including HTML views, PDF and ePub downloads, according to the available data) and Abstracts Views on Vision4Press platform.
Data correspond to usage on the plateform after 2015. The current usage metrics is available 48-96 hours after online publication and is updated daily on week days.
Initial download of the metrics may take a while.