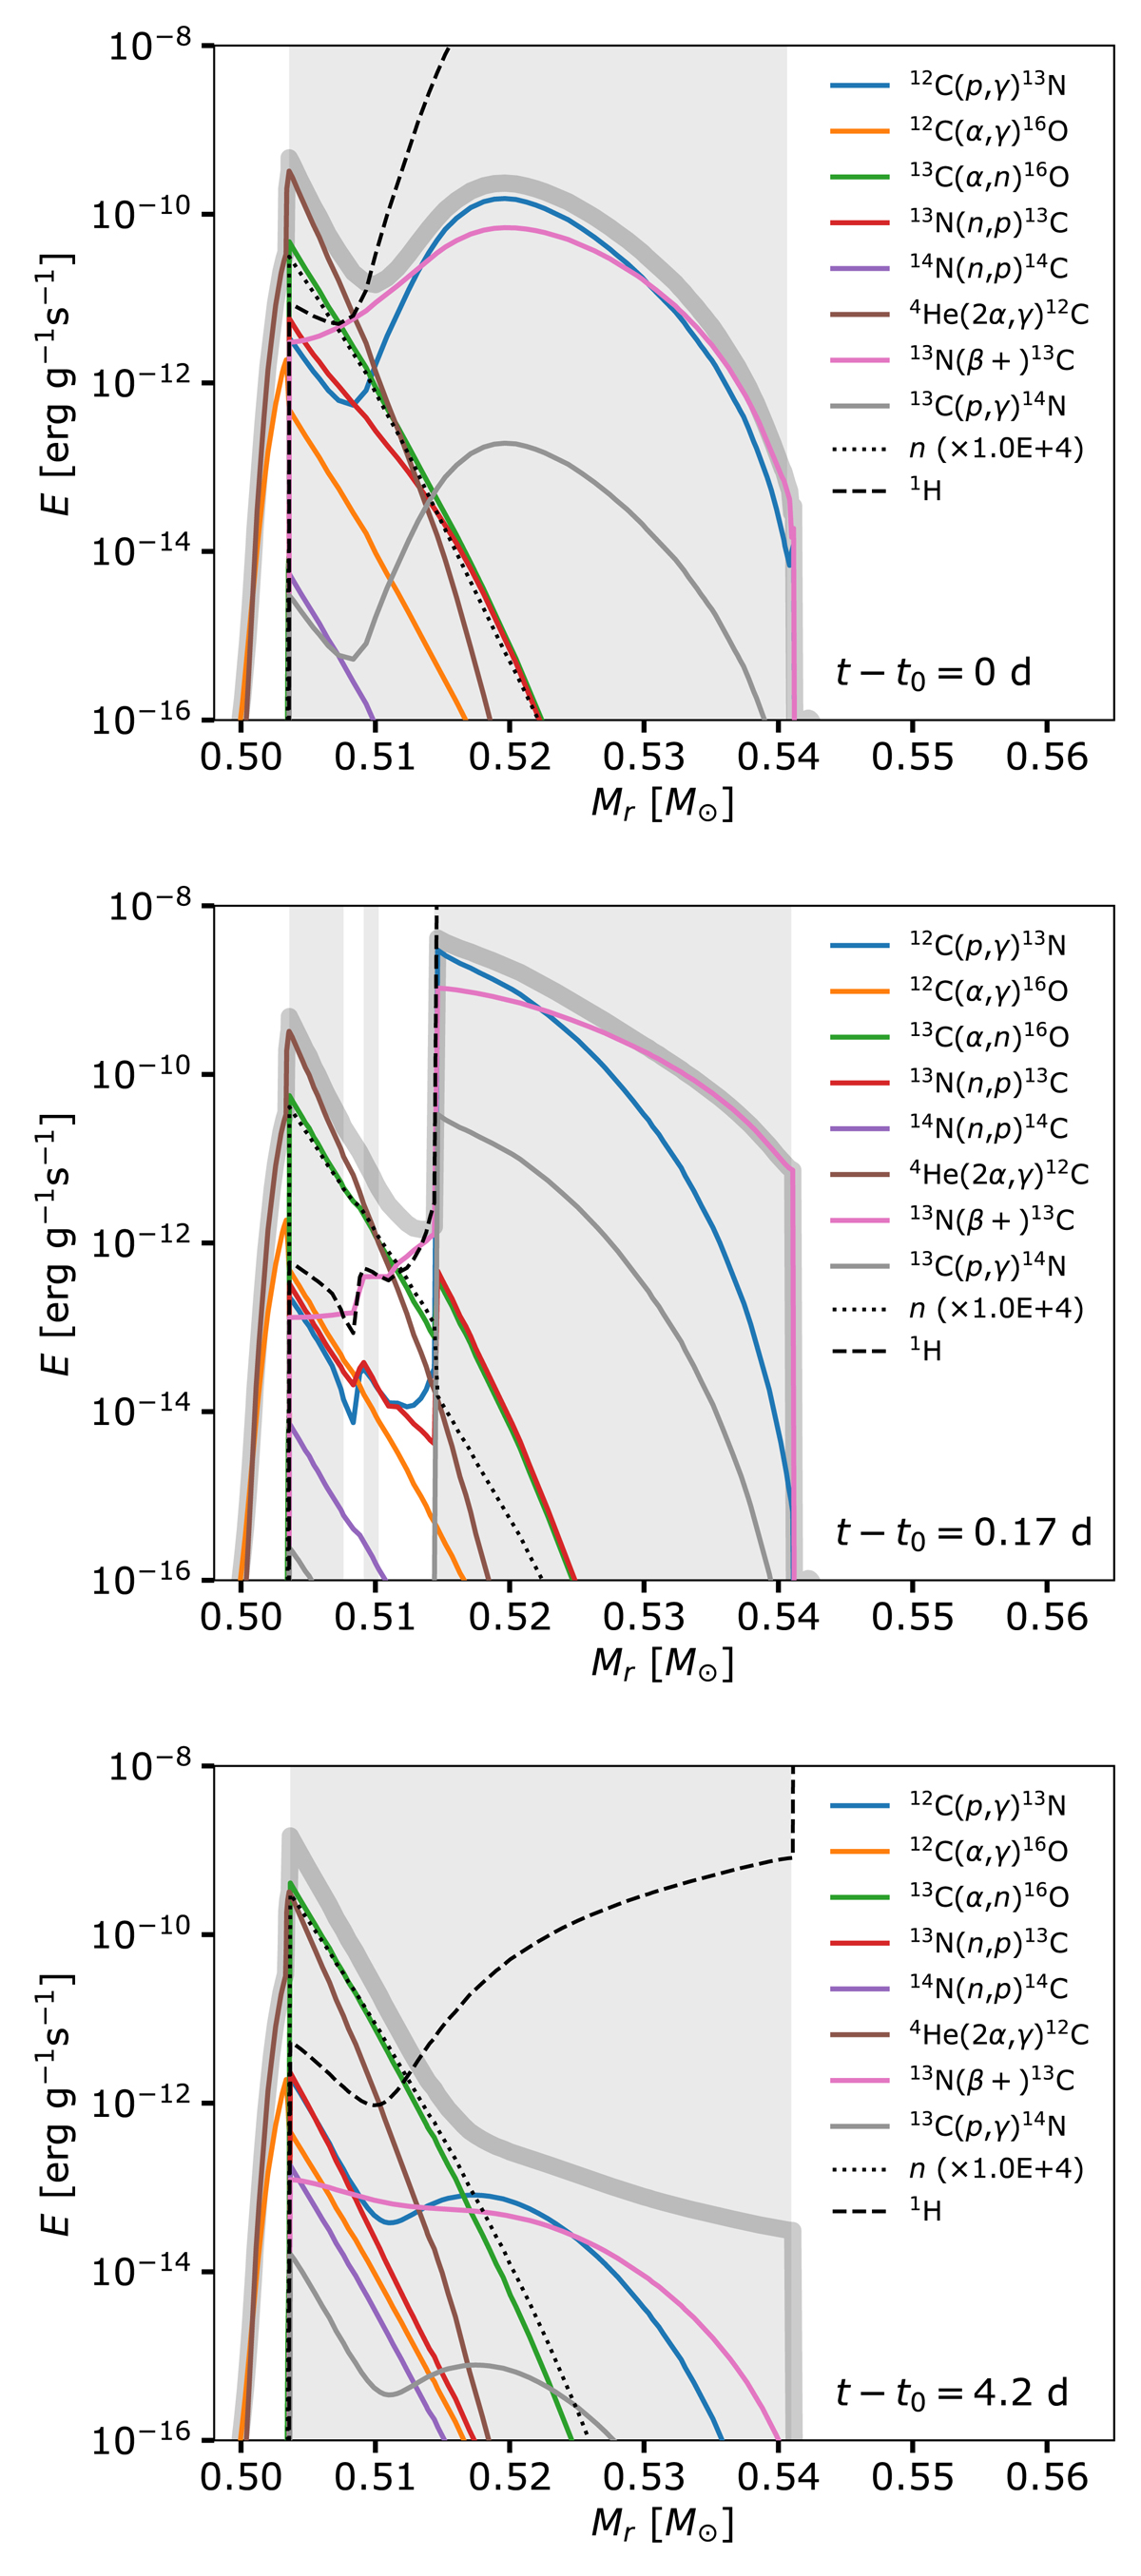
Fig. 5.
Download original image
Energy generation from the main reactions during the PIE in the M1.0z3.0 model just before the splitting (top panel), just after the splitting (middle panel) and just after both parts of the pulse have merged again (bottom panel). The total nuclear energy production rate is shown by the thick grey line. The protons and neutrons mass fractions are shown.
Current usage metrics show cumulative count of Article Views (full-text article views including HTML views, PDF and ePub downloads, according to the available data) and Abstracts Views on Vision4Press platform.
Data correspond to usage on the plateform after 2015. The current usage metrics is available 48-96 hours after online publication and is updated daily on week days.
Initial download of the metrics may take a while.