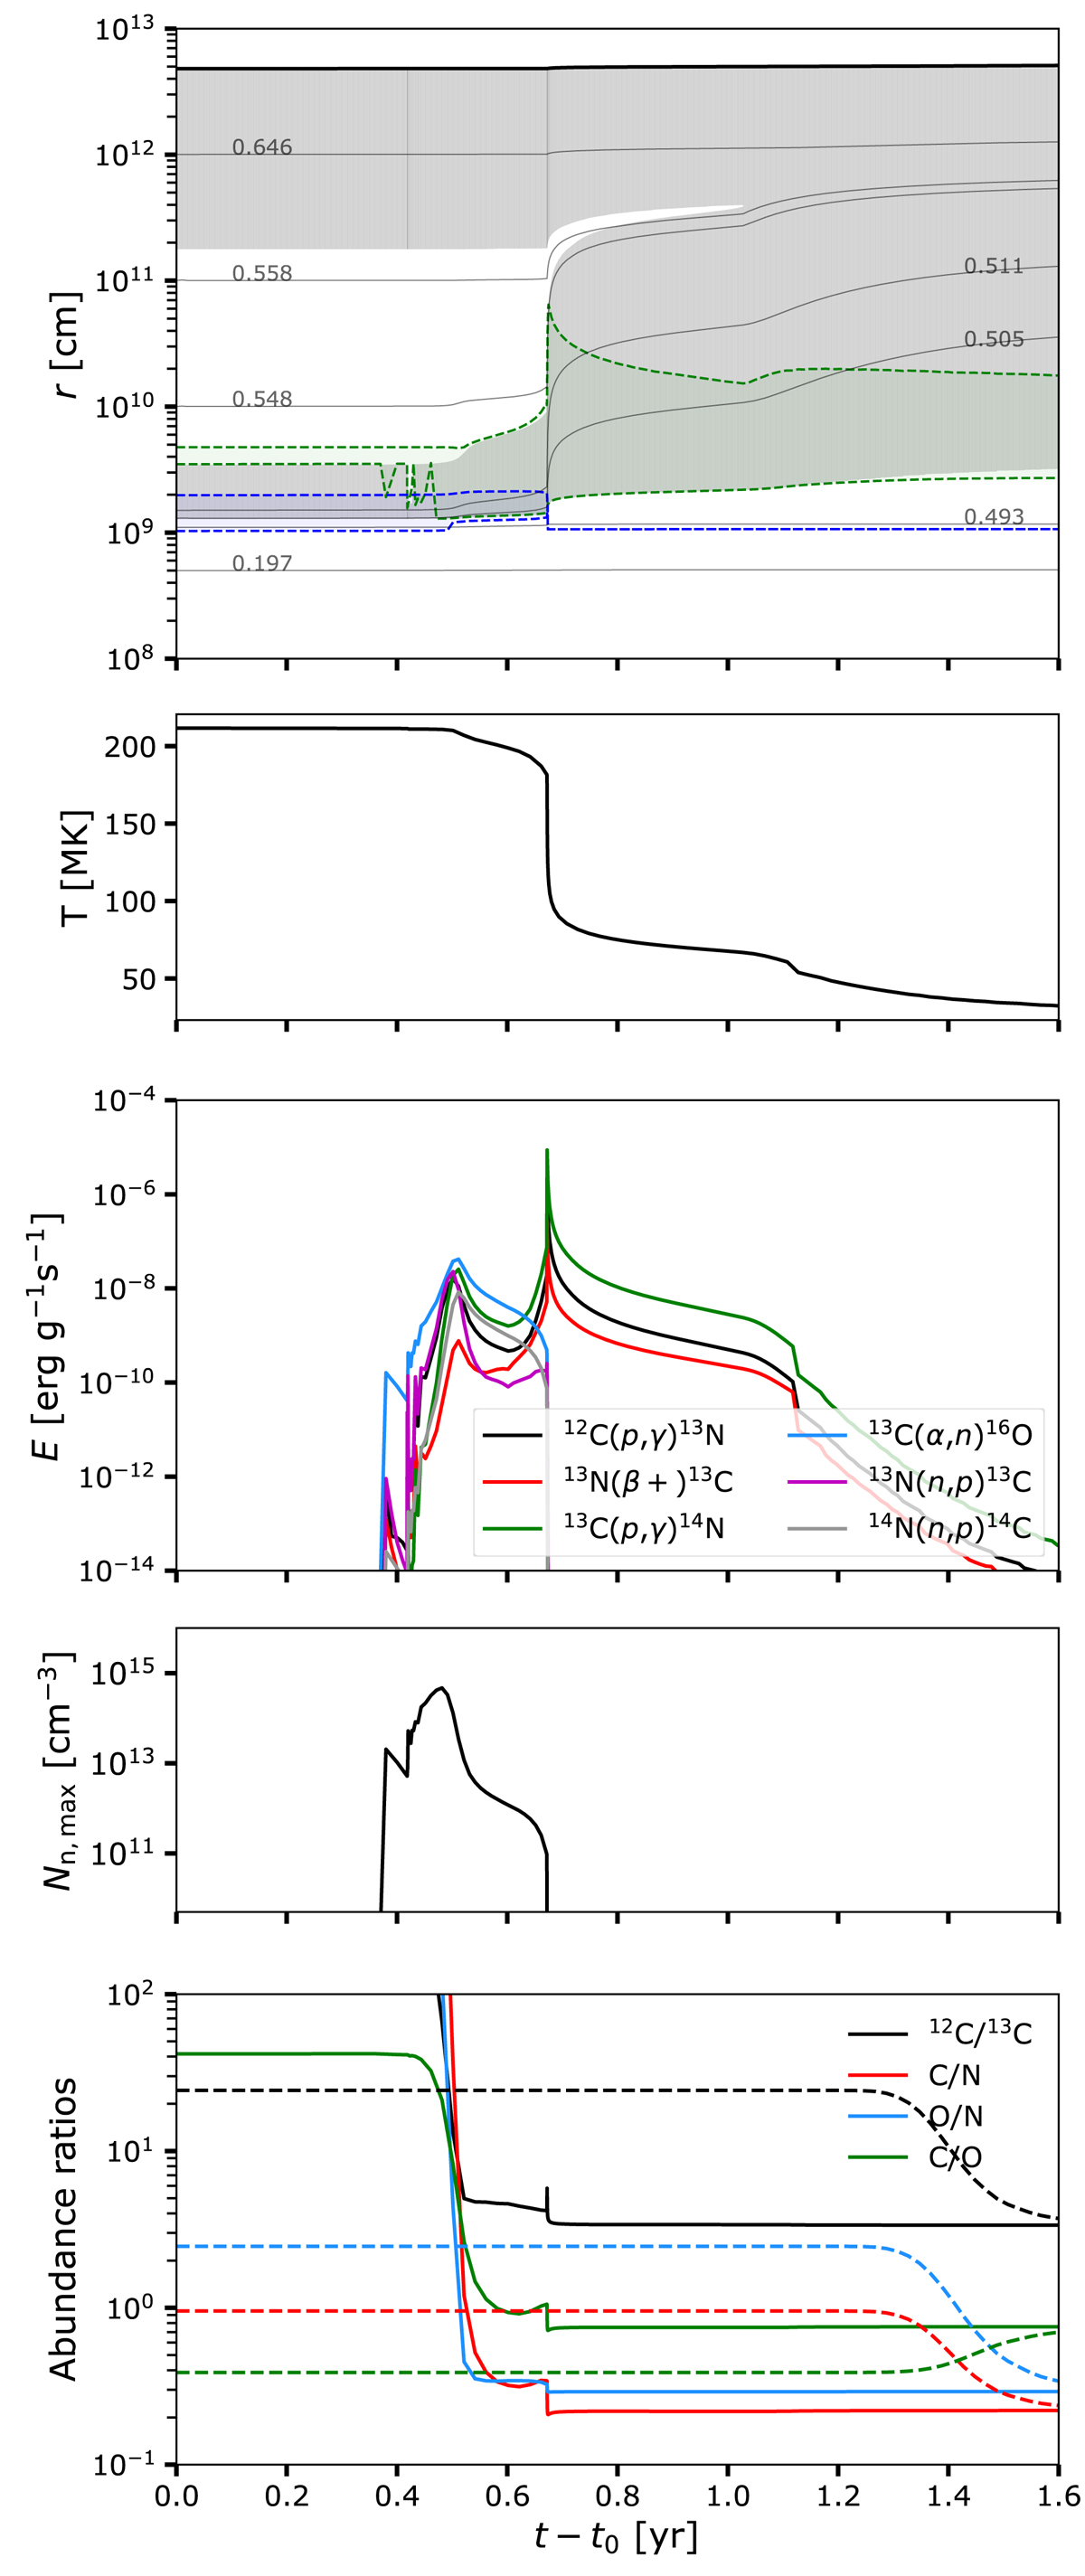
Fig. 1.
Download original image
Evolution of the M1.0z3.0 model during the PIE: Kippenhahn diagram (top panel), temperature at the bottom of the convective thermal pulse (or envelope for t − t0 ≳ 1 yr, second panel), energy released by the main reactions at the bottom of the pulse (or envelope, third panel), maximal neutron density (fourth panel). Bottom panel: 12C/13C, C/N, and O/N ratios at the bottom of the convective zone (solid lines) and at the stellar surface (dashed lines). The dashed green and blue lines in the Kippenhahn diagram (top panel) delineate the hydrogen and helium-burning zones (where the nuclear energy production by H- and He-burning exceeds 10 erg g−1 s−1). The thin light-grey lines indicate iso-masses expressed in M⊙.
Current usage metrics show cumulative count of Article Views (full-text article views including HTML views, PDF and ePub downloads, according to the available data) and Abstracts Views on Vision4Press platform.
Data correspond to usage on the plateform after 2015. The current usage metrics is available 48-96 hours after online publication and is updated daily on week days.
Initial download of the metrics may take a while.