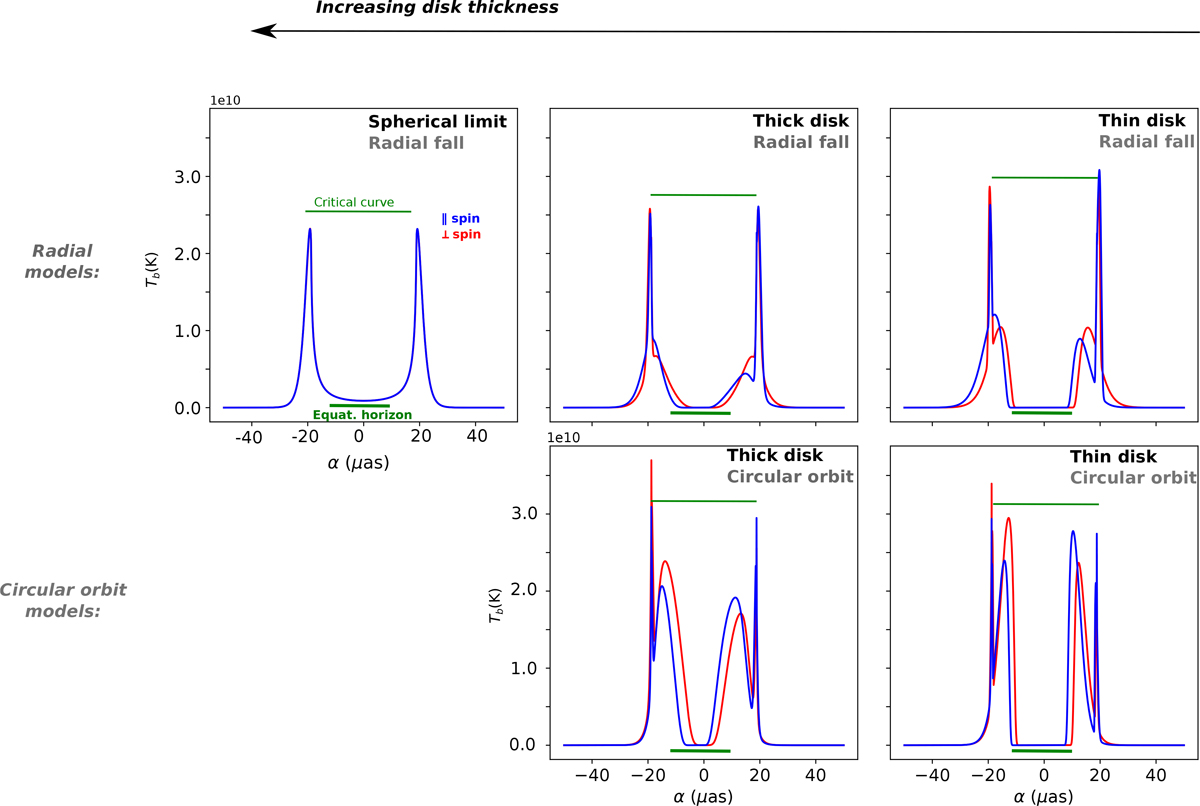
Fig. 6.
Download original image
Intensity cuts for our models. We display cuts along the directions perpendicular to spin (red) and parallel to spin (blue) for spin a = 0.01 for the various thick-disk models used in this article (four central panels), as well as for a spherical model obtained from the thick-disk model in the limit of large disk thickness (top left panel). The size of the critical curve (thin line) and of the primary (n = 0) image of the equatorial horizon (thick line) are shown in green.
Current usage metrics show cumulative count of Article Views (full-text article views including HTML views, PDF and ePub downloads, according to the available data) and Abstracts Views on Vision4Press platform.
Data correspond to usage on the plateform after 2015. The current usage metrics is available 48-96 hours after online publication and is updated daily on week days.
Initial download of the metrics may take a while.