Open Access
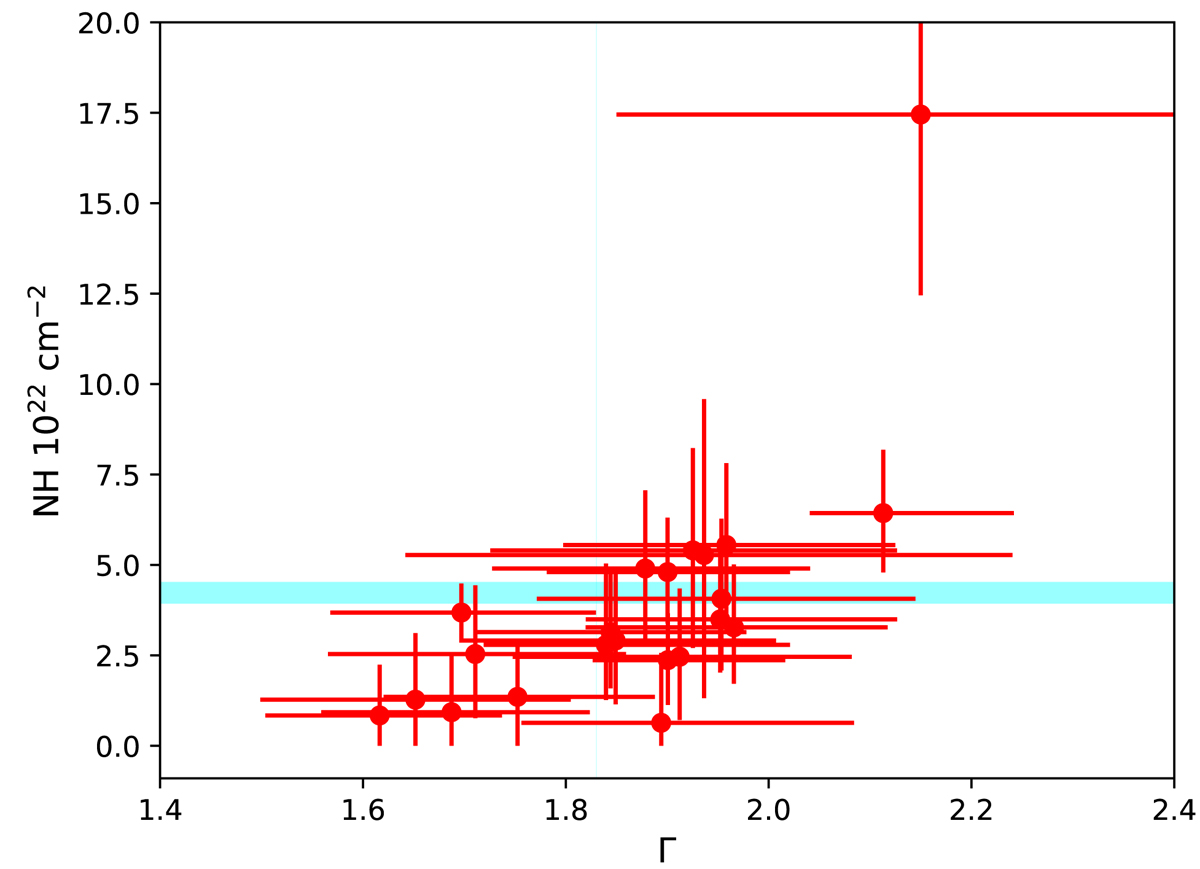
Fig. 8.
Download original image
Scatter plot of the best fit values of the intrinsic absorption NH and the spectral slope Γ for each Obsid. Error bars refer to 1σ c.l. on a single parameter. Shaded area show the 1σ interval for the best fit value of NH from the global fit.
Current usage metrics show cumulative count of Article Views (full-text article views including HTML views, PDF and ePub downloads, according to the available data) and Abstracts Views on Vision4Press platform.
Data correspond to usage on the plateform after 2015. The current usage metrics is available 48-96 hours after online publication and is updated daily on week days.
Initial download of the metrics may take a while.