Fig. 7.
Download original image
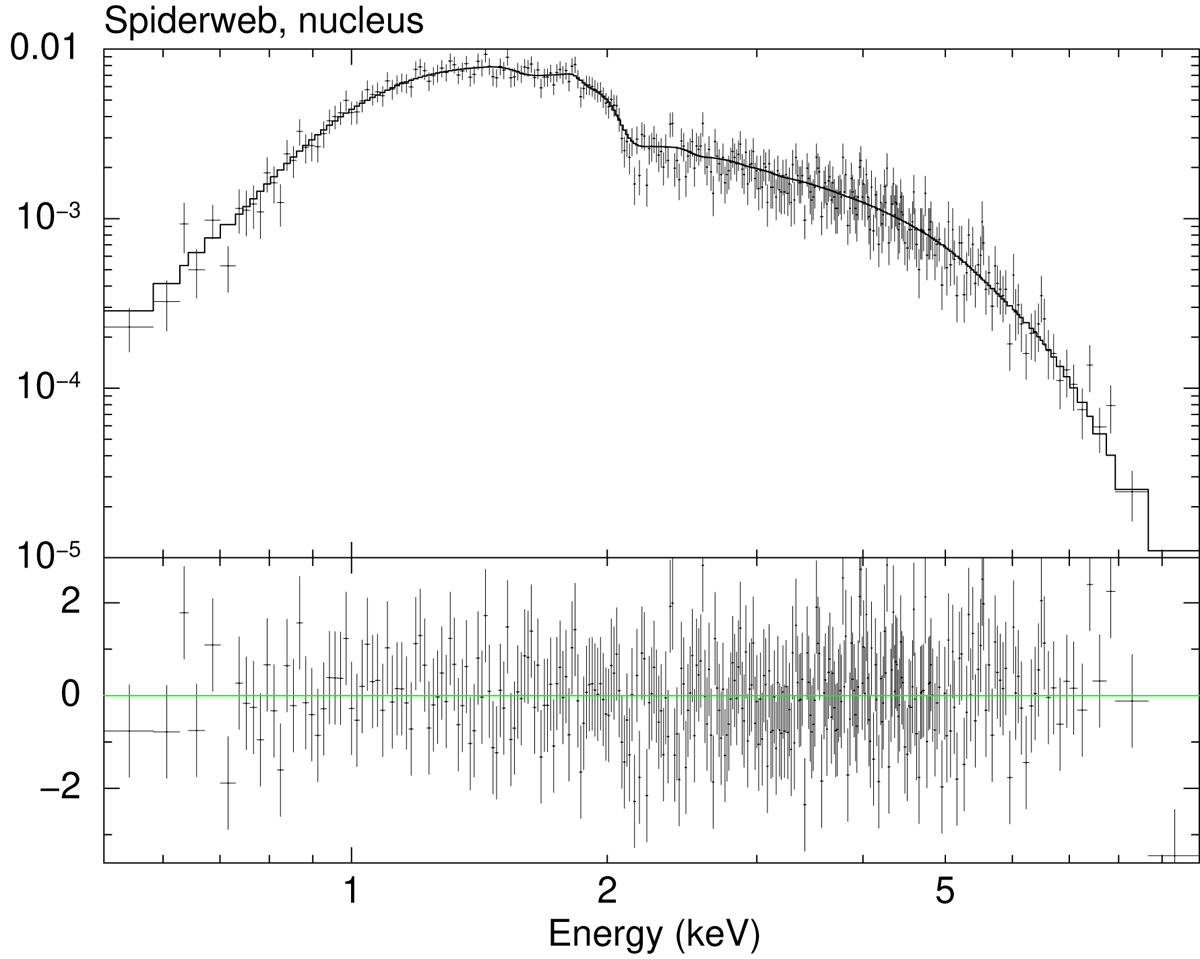
Merged spectrum (folded with the instrument spectral response) of the nucleus of the Spiderweb Galaxy with the best fit model (first column of Table 1, with nd = 4). The residuals are shown in the bottom panel. There is no significant excess in the soft band, showing that diffuse emission is properly accounted for within the limits of the spectrum quality.
Current usage metrics show cumulative count of Article Views (full-text article views including HTML views, PDF and ePub downloads, according to the available data) and Abstracts Views on Vision4Press platform.
Data correspond to usage on the plateform after 2015. The current usage metrics is available 48-96 hours after online publication and is updated daily on week days.
Initial download of the metrics may take a while.