Fig. 15.
Download original image
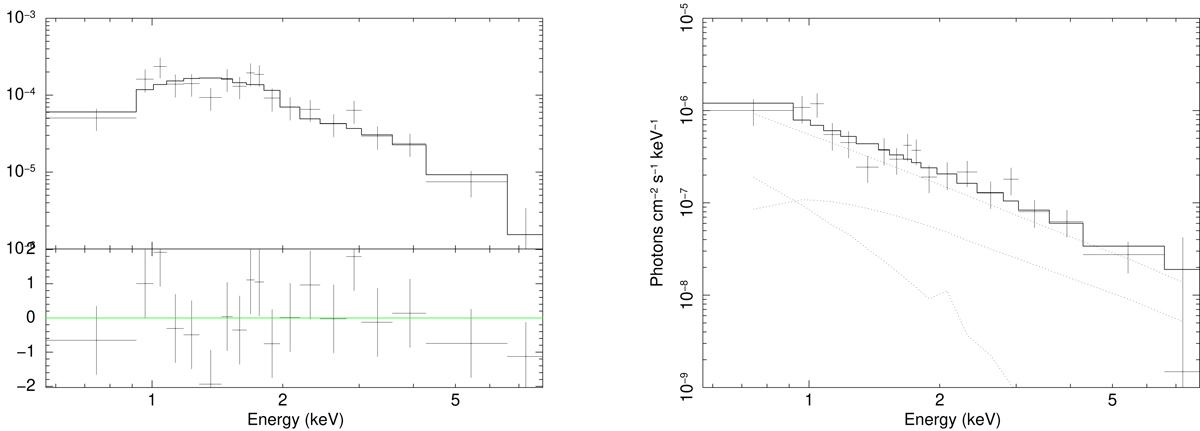
Left: spectrum (folded with the instrument spectral response) of the emission in the west jet region (including the AGN contamination and the residual thermal emission from the ICM) fitted with a power law. Right: unfolded spectrum with the three components in the model shown with dotted lines. The lowest dotted line corresponds to the thermal emission from the overlapping ICM, while the line in the middle accounts for the AGN wings contamination. The IC from the relativistic population in the west jet is shown by the unabsorbed power law that is dominating at any energy.
Current usage metrics show cumulative count of Article Views (full-text article views including HTML views, PDF and ePub downloads, according to the available data) and Abstracts Views on Vision4Press platform.
Data correspond to usage on the plateform after 2015. The current usage metrics is available 48-96 hours after online publication and is updated daily on week days.
Initial download of the metrics may take a while.