Fig. 13.
Download original image
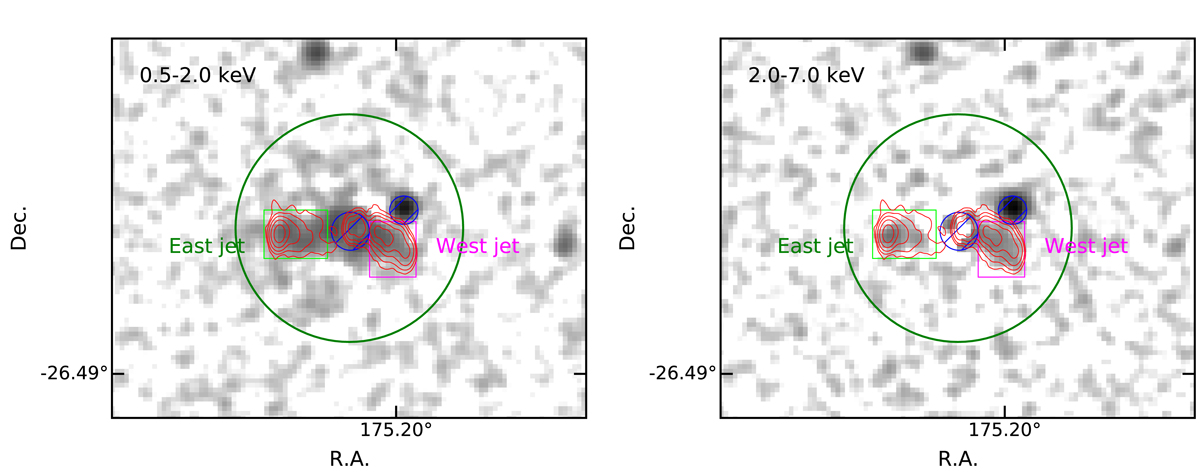
Left: background-subtracted soft band image of the Spiderweb Galaxy after AGN subtraction (with nd = 4). The image has been smoothed with a Gaussian kernel with a sigma of 1 pixel, slightly degrading the effective resolution. The green and magenta boxes correspond to the regions used for the east and west jet spectral analysis, respectively. Two AGN circular extraction regions (in blue) are removed (the AGN, with a radius of 2 arcsec, and a nearby AGN with a radius of 1.5 arcsec). The large green circle is the region used for the spectral analysis of the isotropic diffuse emission, excluding both jet regions and the AGNs. Red contours show radio emission observed in the 10 GHz band with the JVLA (Carilli et al. 2022) at levels of 0.03, 0.2, 2 and 20 mJy beam−1.
Current usage metrics show cumulative count of Article Views (full-text article views including HTML views, PDF and ePub downloads, according to the available data) and Abstracts Views on Vision4Press platform.
Data correspond to usage on the plateform after 2015. The current usage metrics is available 48-96 hours after online publication and is updated daily on week days.
Initial download of the metrics may take a while.