Fig. 10.
Download original image
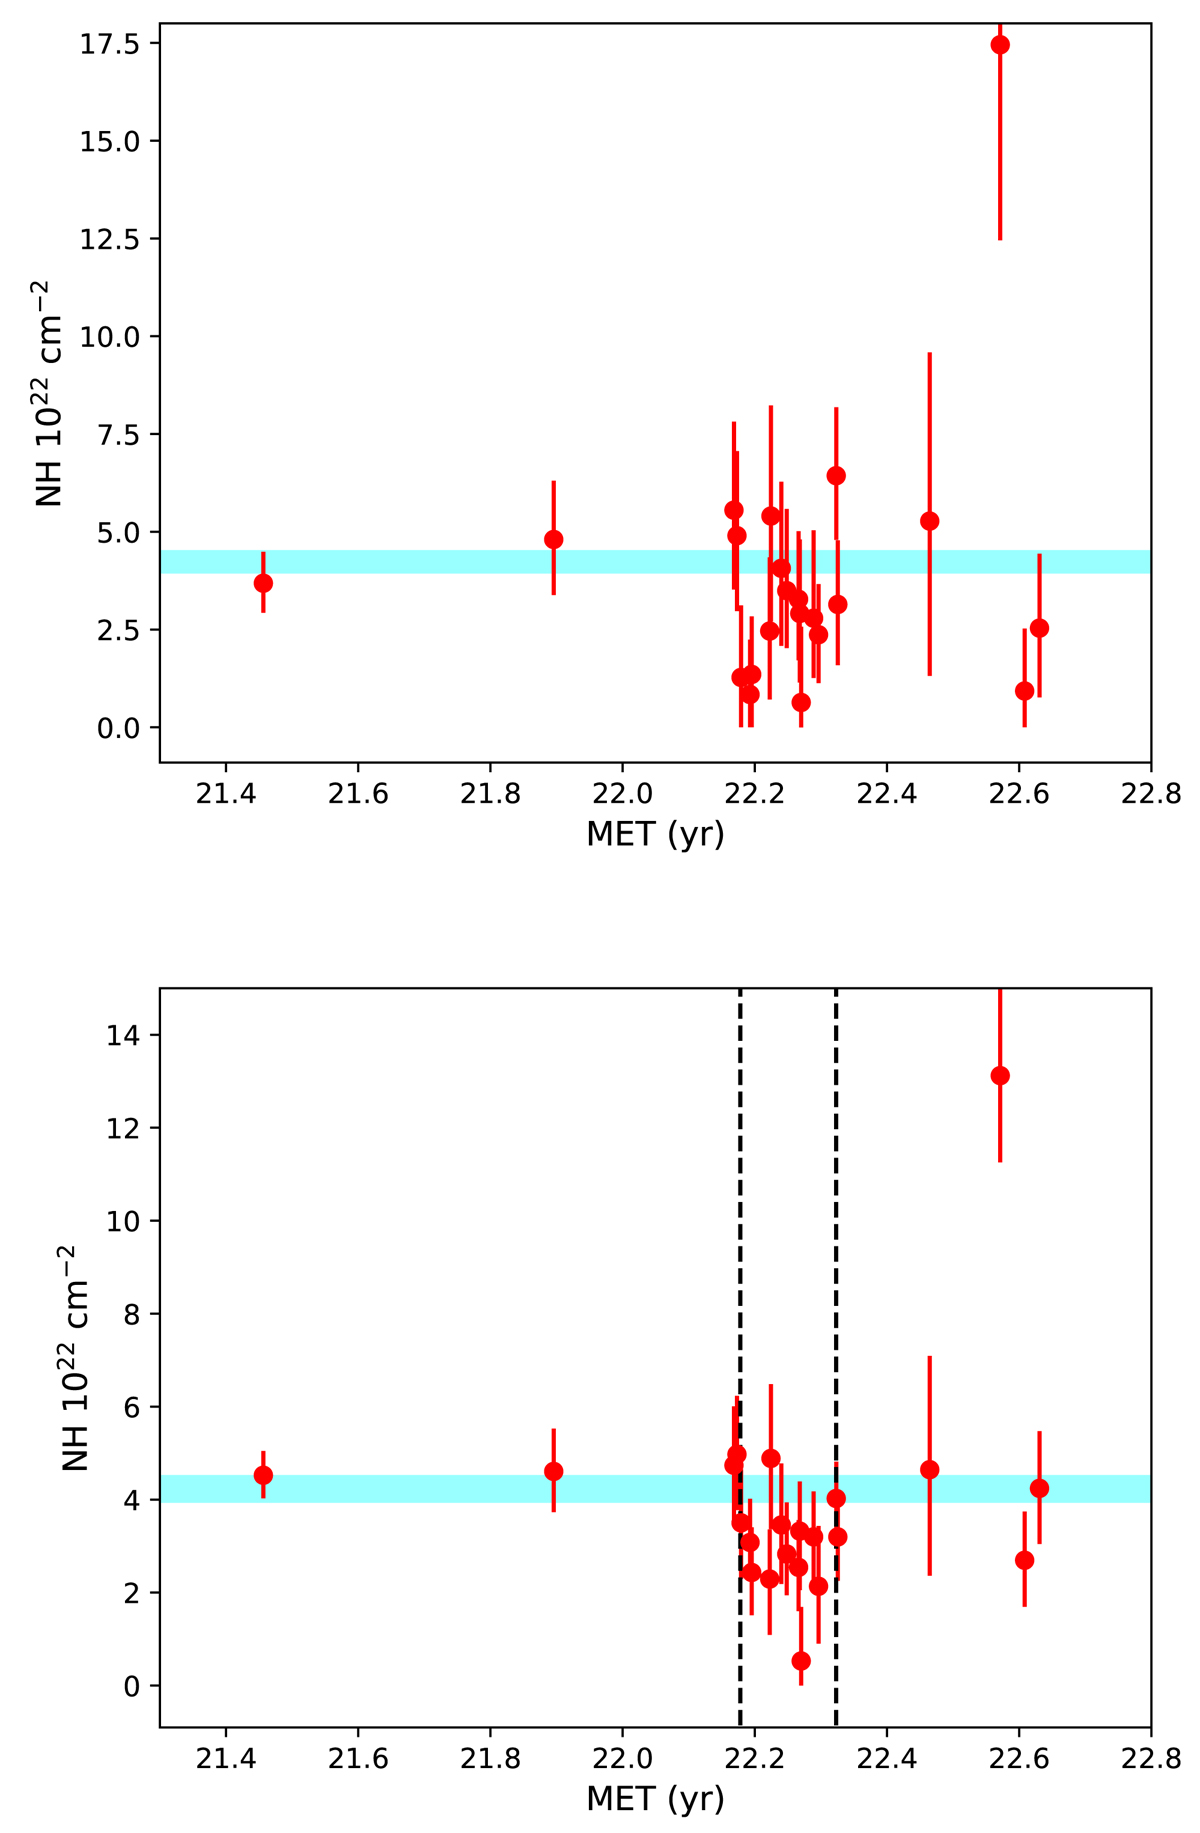
Upper panel: best-fit values of NH for each Obsid as a function of the Mission Timeline MET (years). The first point has been moved to 21.5 to be shown in the same linear plot. The horizontal shaded line shows the best-fit value of the cumulative spectrum with PSF correction, as listed in Table 1. Lower panel: same, but with best-fit values of NH obtained with Γ frozen to 1.88. The vertical dashed lines bracket the period with low intrinsic absorption as discussed in the text.
Current usage metrics show cumulative count of Article Views (full-text article views including HTML views, PDF and ePub downloads, according to the available data) and Abstracts Views on Vision4Press platform.
Data correspond to usage on the plateform after 2015. The current usage metrics is available 48-96 hours after online publication and is updated daily on week days.
Initial download of the metrics may take a while.