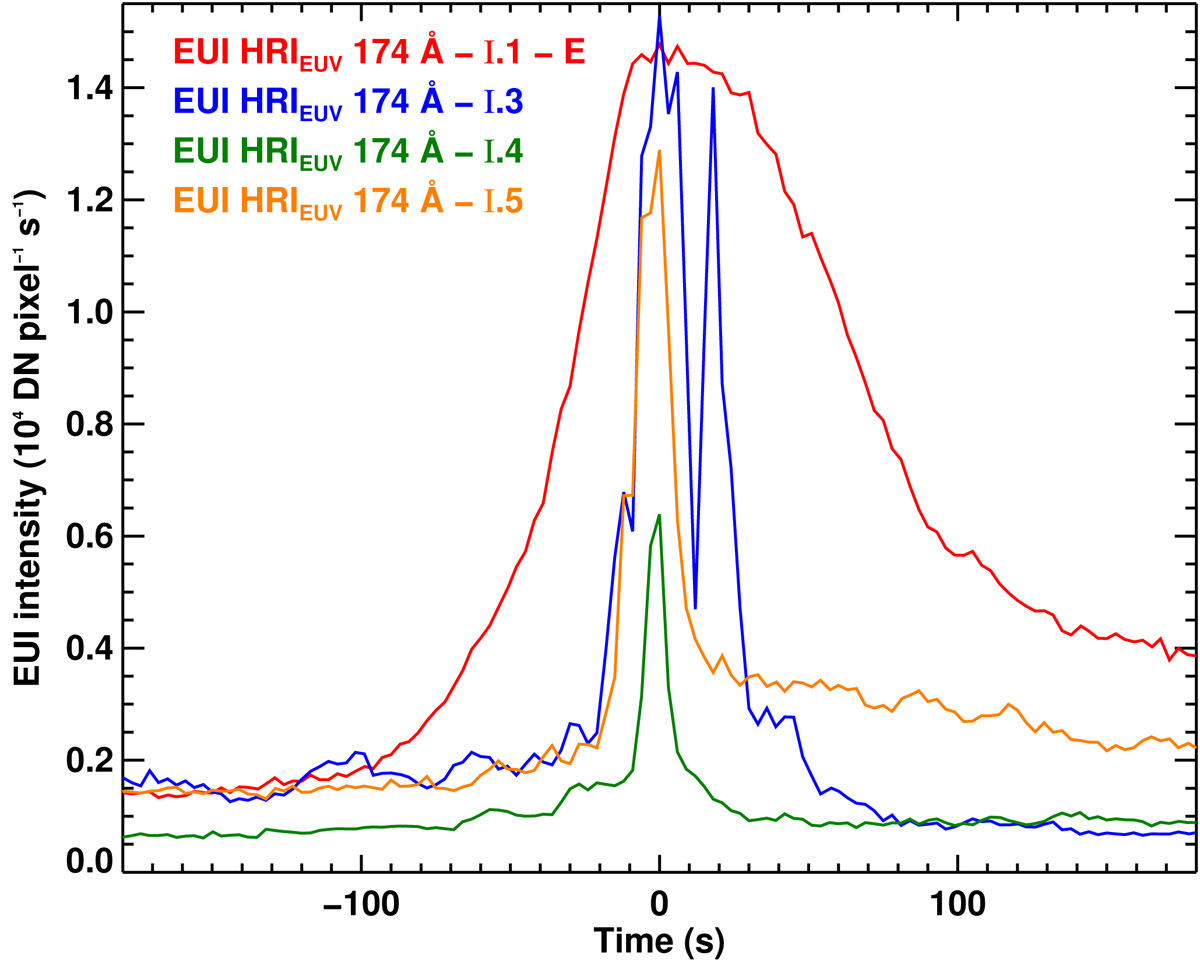
Fig. 6.
Download original image
Comparison of HRIEUV light curves from different heating events. The curve in red is same as that in Fig. 3 (i.e., from point E of the braided loop system in Fig. 2), but not normalized to its peak value. The other three light curves (i.e., I.3–I.5) are obtained from the center of the respective panels in Fig. A.2. The 0 s mark along the abscissa (i.e., the time-axis) is with respect to the peak of each of the light curves. See Sect. 5 for a discussion.
Current usage metrics show cumulative count of Article Views (full-text article views including HTML views, PDF and ePub downloads, according to the available data) and Abstracts Views on Vision4Press platform.
Data correspond to usage on the plateform after 2015. The current usage metrics is available 48-96 hours after online publication and is updated daily on week days.
Initial download of the metrics may take a while.