Fig. 3.
Download original image
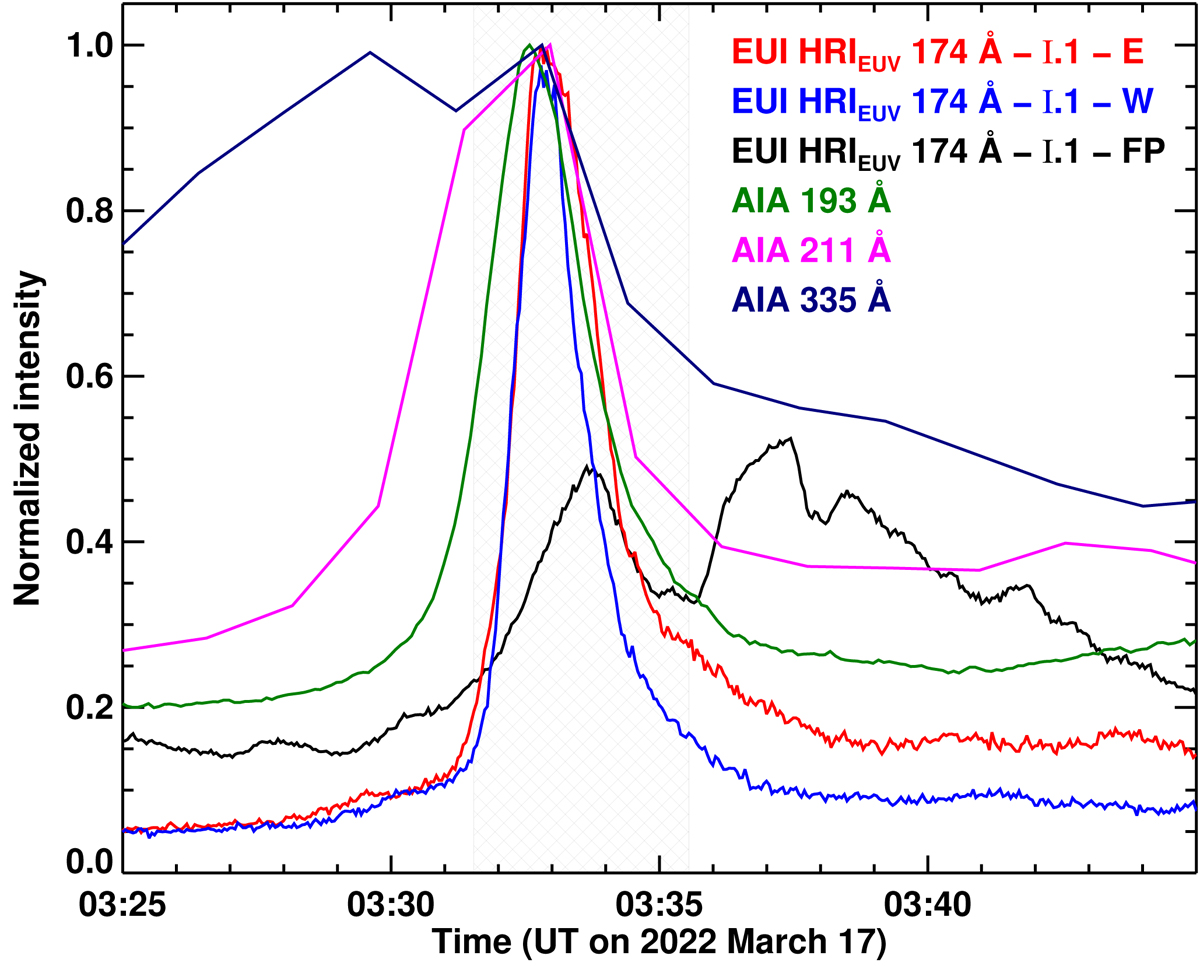
Extreme ultraviolet emission characteristics of the braided loops. We plot the normalized EUV intensity from the HRIEUV and SDO/AIA instruments. The red and blue light curves show the time evolution of EUV emission from braided loops at the pixels marked E and W in Fig. 2a. The black curve is the average intensity from the footpoint region of the braided loops, labeled FP, in Fig. 2a. The SDO/AIA light curves (dark green: 193 Å; magenta: 211 Å; dark blue: 335 Å) show the mean EUV intensity computed from the black boxes overlaid on the braided loops in the respective passband panels in Fig. 2. The hatched region spans the duration covered by Fig. A.3, which shows the relaxation of braided loops. See Sect. 3 for a discussion.
Current usage metrics show cumulative count of Article Views (full-text article views including HTML views, PDF and ePub downloads, according to the available data) and Abstracts Views on Vision4Press platform.
Data correspond to usage on the plateform after 2015. The current usage metrics is available 48-96 hours after online publication and is updated daily on week days.
Initial download of the metrics may take a while.