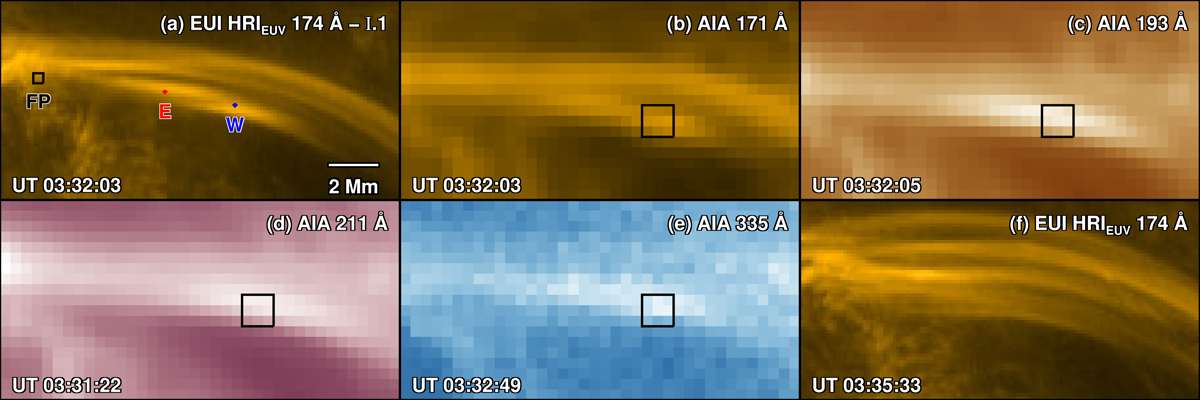
Fig. 2.
Download original image
Braided coronal loops. Panel a: a segment of braided coronal loops observed in the core of AR-I with HRIEUV (box I.1 in Fig. 1). Red and blue pixels, labeled E and W, mark the eastern and western sections of the braided loops, while the black box FP is placed at the footpoint region of these loops. The time-stamp of the snapshot and the spatial scale (using a 2 Mm bar) are also indicated. Panels b–e: same braided loops from the perspective of SDO/AIA in different EUV passbands as labeled. The projected area of these panels is roughly the same as that of panel a. The black box in panels b–e is overlaid on the location of the braided loops. The mean emission of the respective AIA passbands computed from the region covered by this black box is plotted in Fig. 3. Panel f: the HRIEUV snapshot shows the relaxed state of the initially braided loops, only about 3 min after panel a; see also Fig. A.3 for the detailed evolution of the braided loops. The intensities of all the snapshots are on a square-root-scale. See Sect. 3 for a discussion. An animation of panel a is available online.
Current usage metrics show cumulative count of Article Views (full-text article views including HTML views, PDF and ePub downloads, according to the available data) and Abstracts Views on Vision4Press platform.
Data correspond to usage on the plateform after 2015. The current usage metrics is available 48-96 hours after online publication and is updated daily on week days.
Initial download of the metrics may take a while.