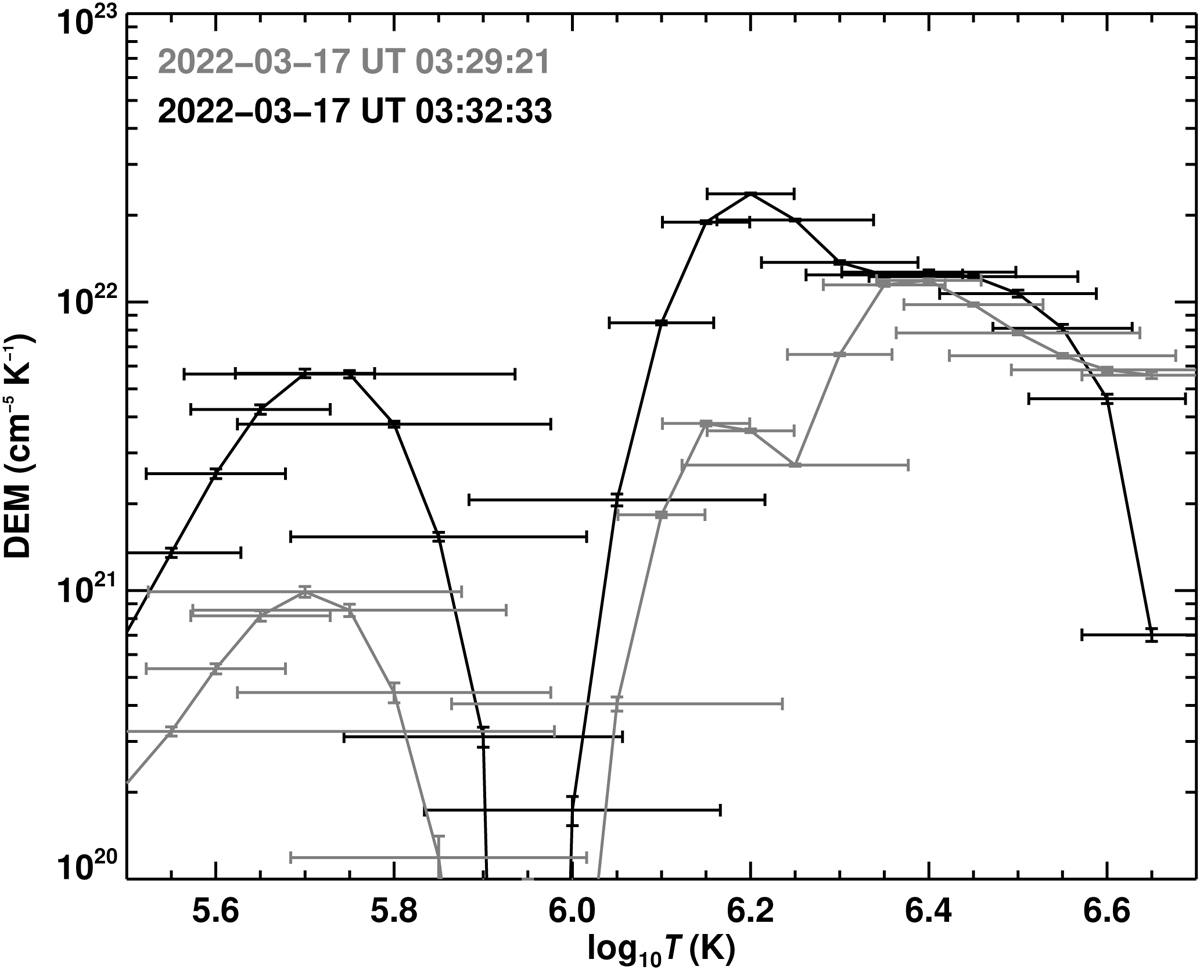
Fig. B.1.
Download original image
Thermal diagnostics of the braided loops. We plot the DEM as a function of temperature for the SDO/AIA mean intensities derived from the braided loops (i.e., the black box on AIA panels in Fig. 2). The gray and black curves are computed at time-stamps overlaid on the plot. The vertical error bars correspond to 1σ errors in the DEM, while the horizontal bars indicate the energy resolution of the regularized inversion technique. See Appendix B for a discussion.
Current usage metrics show cumulative count of Article Views (full-text article views including HTML views, PDF and ePub downloads, according to the available data) and Abstracts Views on Vision4Press platform.
Data correspond to usage on the plateform after 2015. The current usage metrics is available 48-96 hours after online publication and is updated daily on week days.
Initial download of the metrics may take a while.