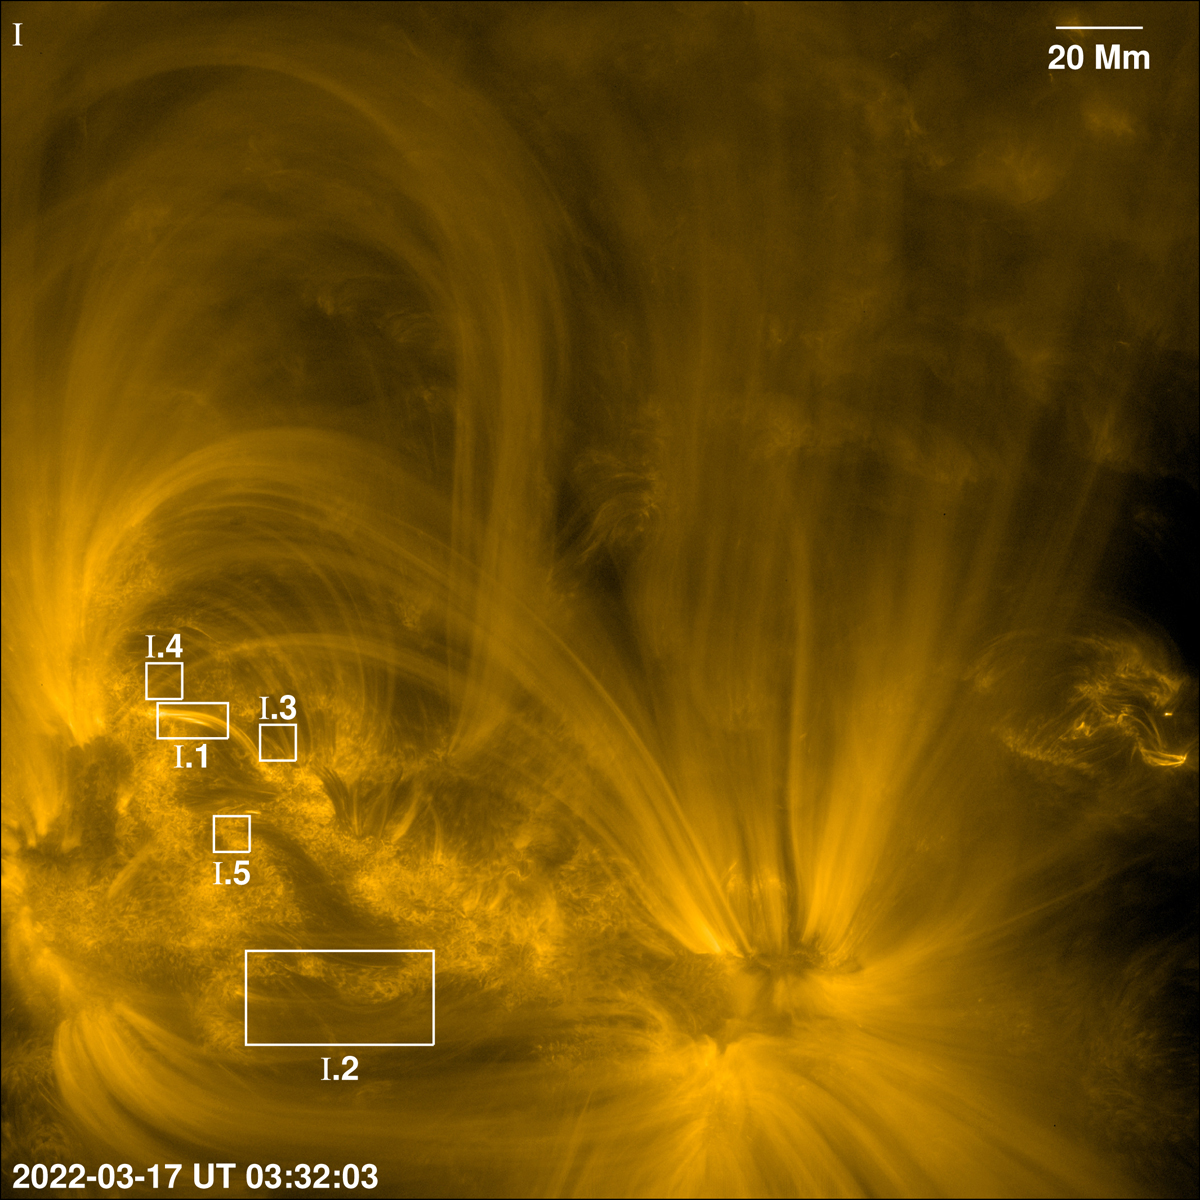
Fig. 1.
Download original image
Overview of AR12965 (AR-I) as observed with EUI/HRIEUV on 2022 March 17. The snapshot shows the full field of view of the HRIEUV covering AR-I. See Table 1 for observational details. Boxes I.1–I.5 cover different regions exhibiting intermittent heating events in the corona that we analyzed. Close-up views of regions I.1 and I.2 are displayed in Figs. 2 and 4, respectively. Regions I.3–I.5 are displayed in Fig. A.2. The intensity of the displayed image is on a log scale. North is approximately up. See Sects. 2 and 3 and Appendix A for a discussion.
Current usage metrics show cumulative count of Article Views (full-text article views including HTML views, PDF and ePub downloads, according to the available data) and Abstracts Views on Vision4Press platform.
Data correspond to usage on the plateform after 2015. The current usage metrics is available 48-96 hours after online publication and is updated daily on week days.
Initial download of the metrics may take a while.