Fig. A.4.
Download original image
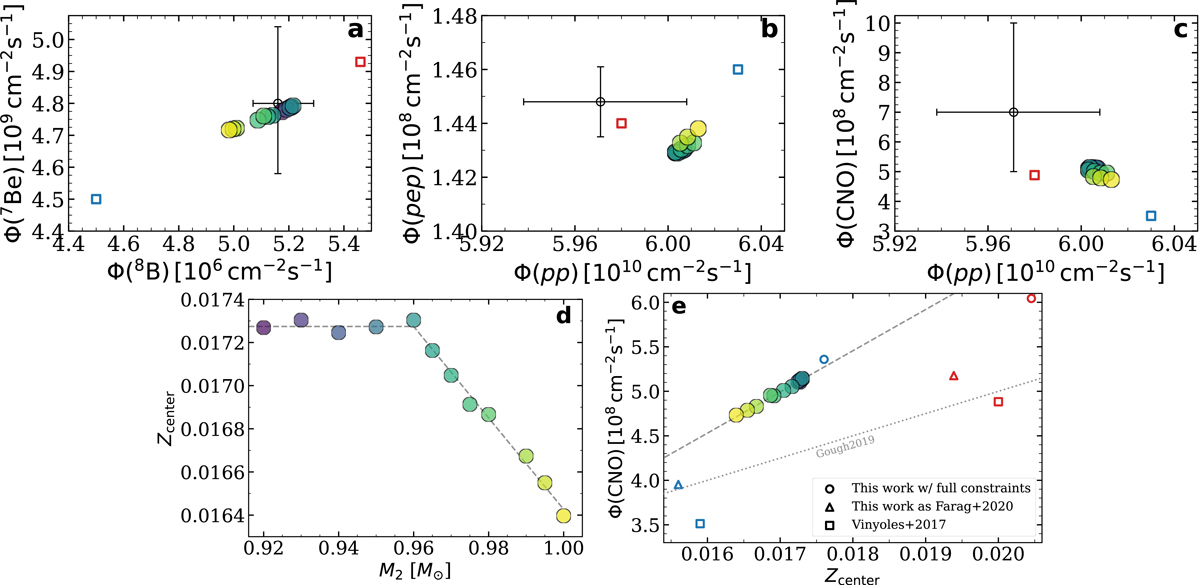
Neutrino fluxes and central metallicity of the models with different planet formation scenarios. The color of the filled circles (model M2var) corresponds to the M2 value (see panel (d)), which is the protosolar mass when the accretion metallicity decreases. The dotted line in panel (e) shows the relation in Gough (2019), and the dashed lines in panels (d) and (e) show the fits of our M2var models. The black circles with error bars show the observed constraints. The red and blue points indicate the models with the old high-Z GS98 composition and the low-Z AGSS09 composition, respectively.
Current usage metrics show cumulative count of Article Views (full-text article views including HTML views, PDF and ePub downloads, according to the available data) and Abstracts Views on Vision4Press platform.
Data correspond to usage on the plateform after 2015. The current usage metrics is available 48-96 hours after online publication and is updated daily on week days.
Initial download of the metrics may take a while.