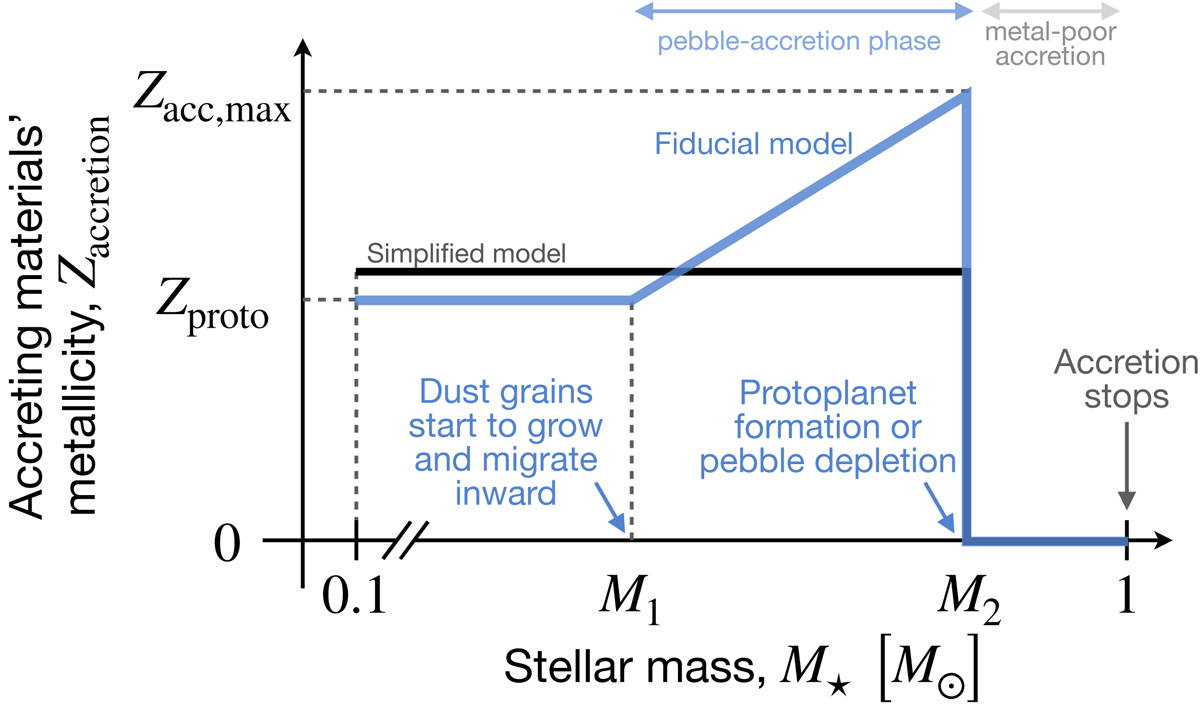
Fig. A.3.
Download original image
Time evolution of the metallicity of accreted gas. The blue line indicates our fiducial Zaccretion model, where it increases from Zproto at M⋆ = M1 to Zacc, max at M2 followed by a metal-poor accretion phase. The black line indicates the simplified model (model M2var; see Fig. A.4), which has the same M2 and the total amount of accreted metals as the blue line. If this M2 value is lower than 0.96 M⊙ (which approximately corresponds to when the radiative core develops), then these two models lead to the same Zcenter.
Current usage metrics show cumulative count of Article Views (full-text article views including HTML views, PDF and ePub downloads, according to the available data) and Abstracts Views on Vision4Press platform.
Data correspond to usage on the plateform after 2015. The current usage metrics is available 48-96 hours after online publication and is updated daily on week days.
Initial download of the metrics may take a while.