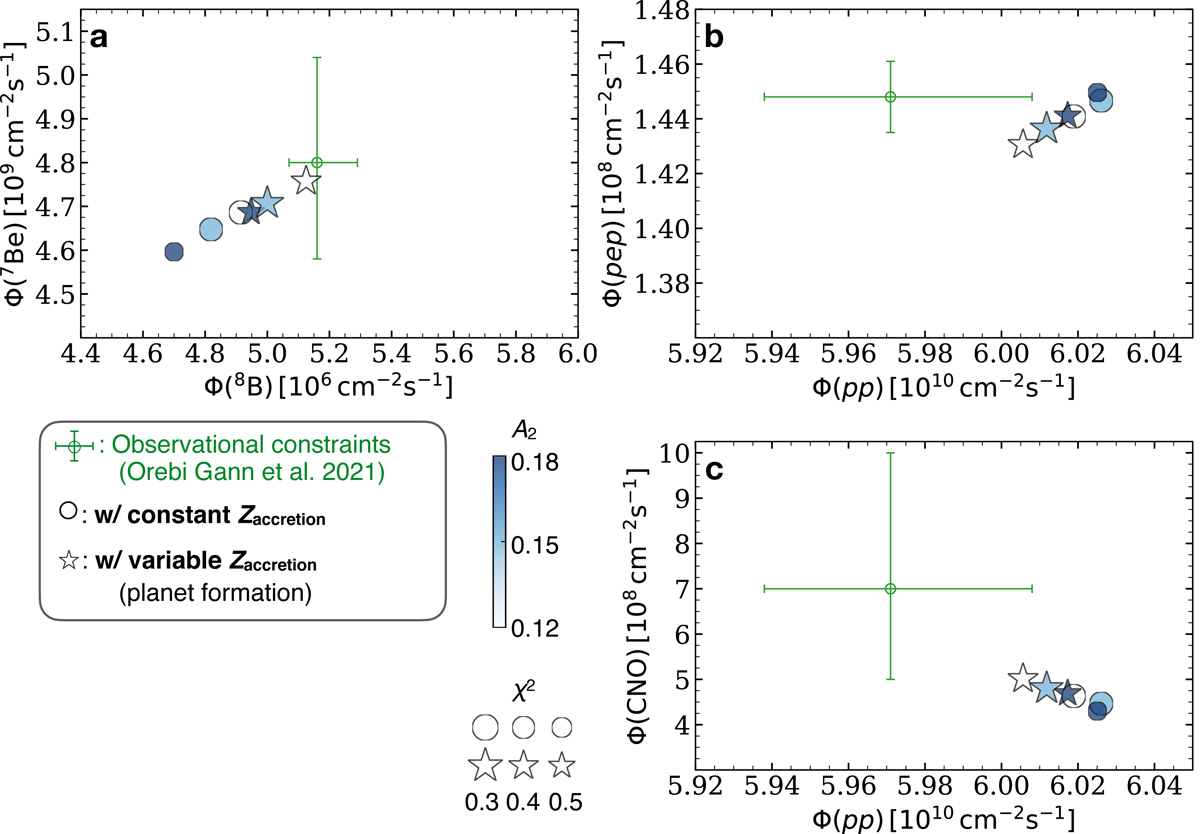
Fig. 2.
Download original image
Neutrino fluxes obtained for the models with an opacity increase and planet formation. Shown are the models with an opacity increase (circles; see also Fig. 1) and with both an opacity increase and a variable Zaccretion (i.e., planet formation processes; star symbols). The colors show the opacity increase A2 ∈ [0.12, 0.18]. The opacity increase in this range leads to a better match with spectroscopic and helioseismic observations (χ2 ≲ 0.5 indicated by the size). A higher opacity increase leads to lower Φ(8B), Φ(7Be), and Φ(CNO) values, whereas the planet formation processes lead to higher values. Consequently, our best model with both an opacity increase of A2 = 0.12 and planet formation processes (i.e., star symbol with white color) reproduces not only the observed constraints of neutrino fluxes (green circles with error bars) but also the spectroscopic and helioseismic observations. (See “K2-MZvar-A2-12” and “K2-A2-12” in Table A.1 and the CDS table for more details about the models with A2 = 0.12 and with and without planet formation processes, respectively.)
Current usage metrics show cumulative count of Article Views (full-text article views including HTML views, PDF and ePub downloads, according to the available data) and Abstracts Views on Vision4Press platform.
Data correspond to usage on the plateform after 2015. The current usage metrics is available 48-96 hours after online publication and is updated daily on week days.
Initial download of the metrics may take a while.