Fig. 5.
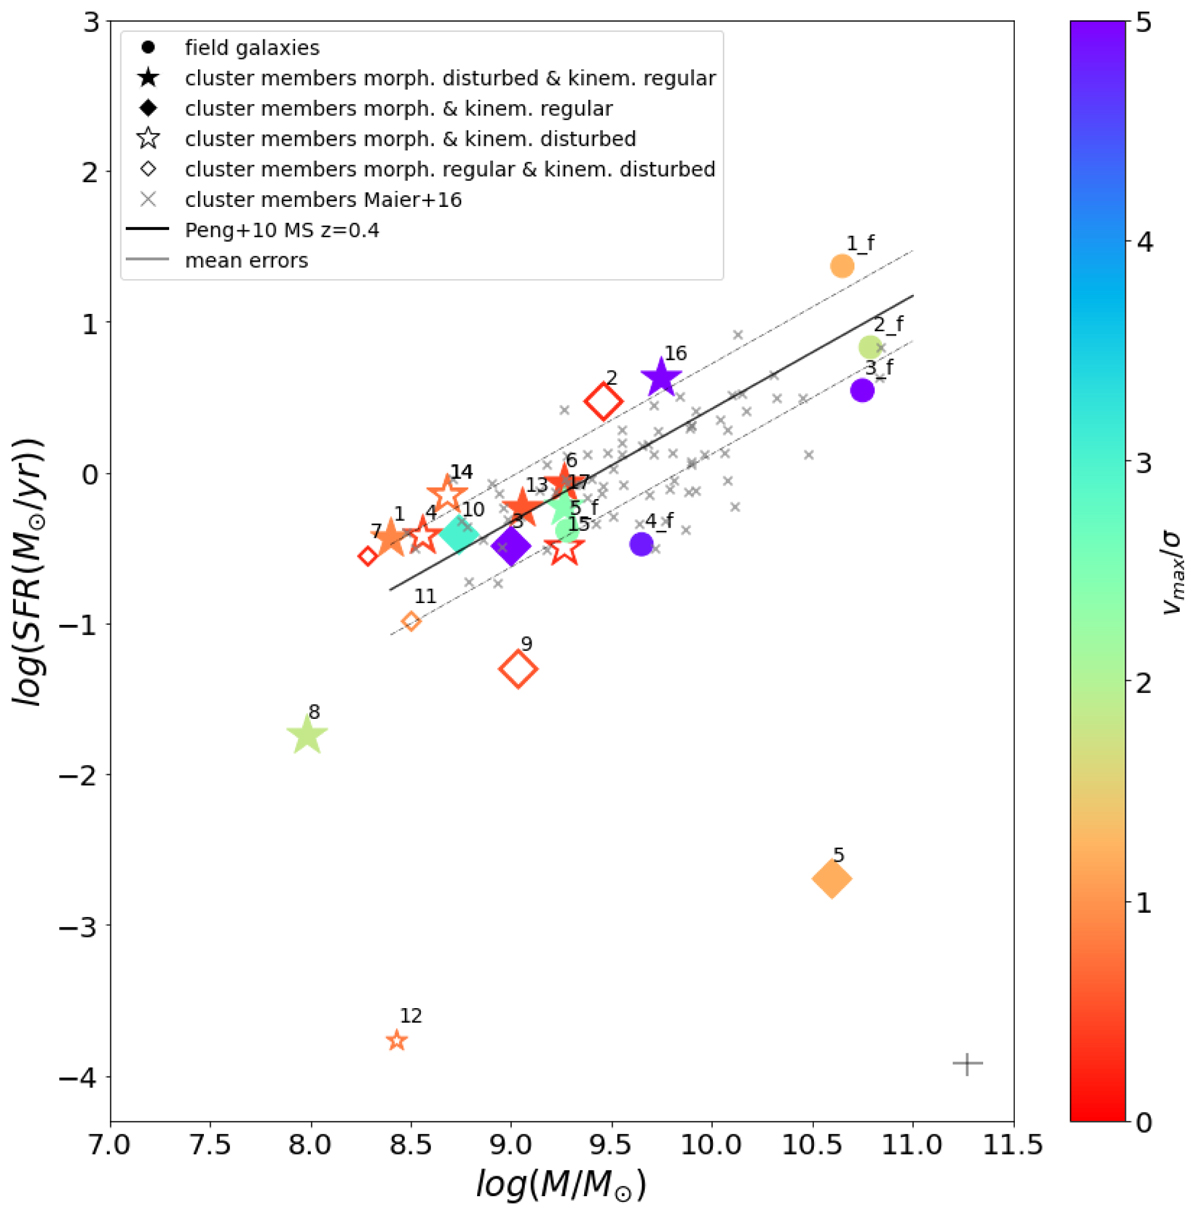
Download original image
Stellar mass–SFR relation, as derived from the photometric data using the LePhare code, for all galaxies analysed in this study. The symbols are the same as in as in Fig. 4, but in addition, we also plot here the M0416 star-forming cluster members from Maier et al. (2016), observed with the VLT/VIMOS, as light grey crosses. The black solid and dashed lines represent the star-forming MS at z = 0.4 and its ∼0.3 dex scatter, as derived by Peng et al. (2010b). The grey cross in the lower right corner of the plot shows the measurement errors for the SFRs and stellar masses.
Current usage metrics show cumulative count of Article Views (full-text article views including HTML views, PDF and ePub downloads, according to the available data) and Abstracts Views on Vision4Press platform.
Data correspond to usage on the plateform after 2015. The current usage metrics is available 48-96 hours after online publication and is updated daily on week days.
Initial download of the metrics may take a while.