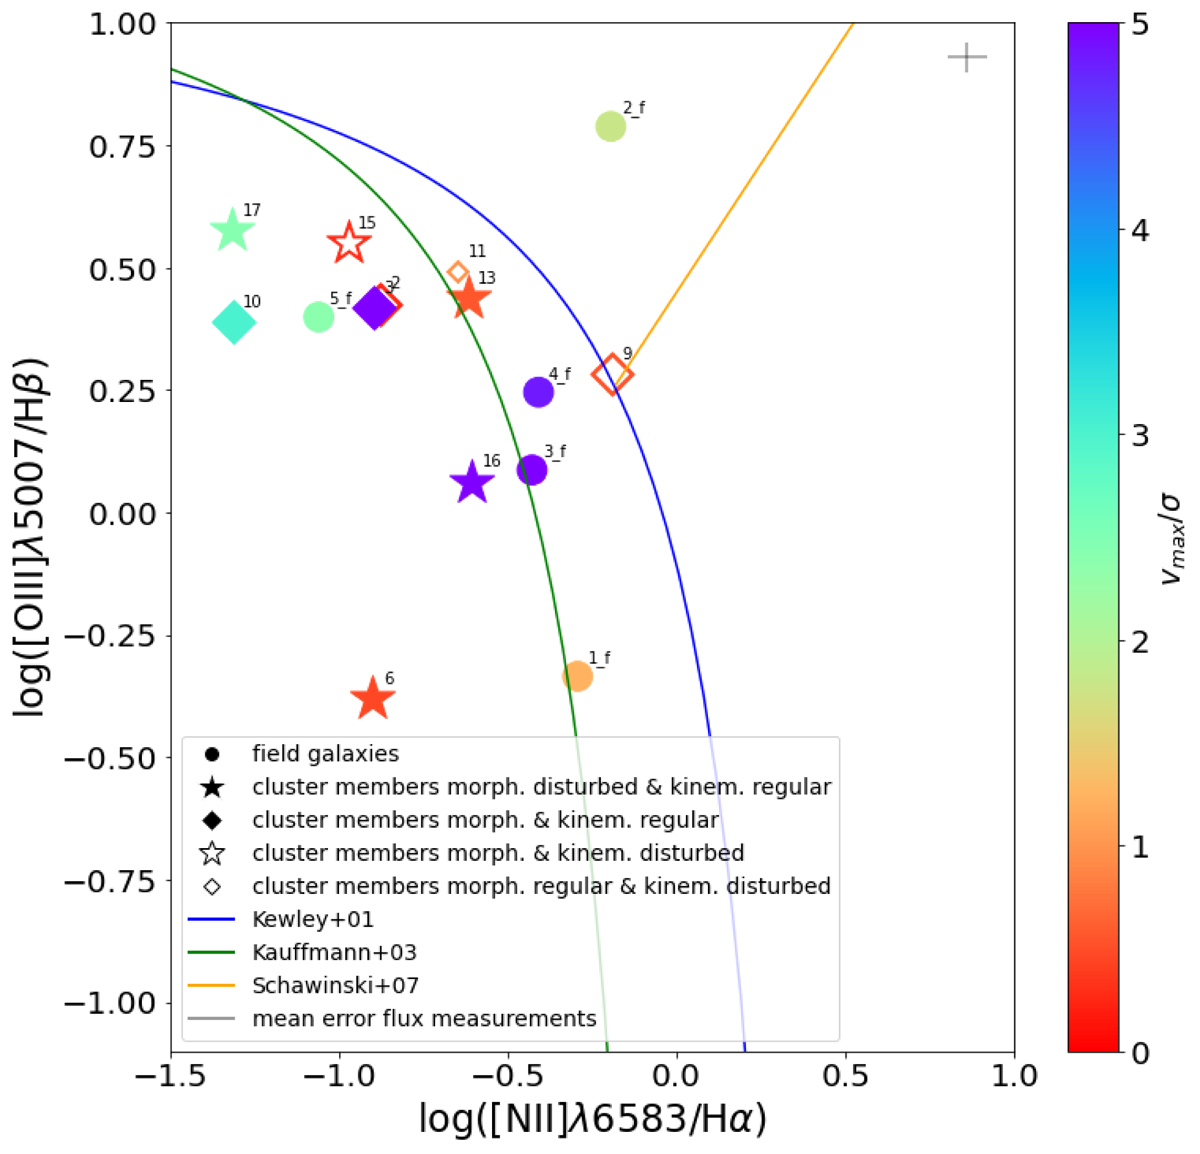
Fig. 4.
Download original image
BPT diagnostic diagram (Baldwin et al. 1981) to distinguish the ionisation mechanism of the nebular gas. The blue curve represents the theoretical curve of Kewley et al. (2001) and the green one the empirical curve of Kauffmann et al. (2003), which separate star-forming galaxies from AGNs. The orange curve of Schawinski & Thomas (2007) depicts the separation line between Seyfert II galaxies and LINERs. Each data point represents one galaxy from our sample, which has an S/N > 10 in the emission lines used for the diagnostic. The diamonds show the cluster members with regular morphologies, whereas the stars depict the cluster galaxies with disturbed morphologies, which show signs of gravitational interactions. The filled symbols represent the galaxies with regular velocity fields, and the open symbols show the galaxies with disturbed velocity fields, for which no rotation is evident in the observed velocity maps. The circles show the field galaxies. The symbols are colour-coded according to vmax, gas/σgas. The size of the symbols depicts whether the galaxies are resolved (big symbols) or just marginally resolved in the MUSE data, meaning that they have measurements only for a few spaxels (small symbols). The labels indicate the galaxy IDs. The cross from the upper right corner shows the mean error of the flux measurements.
Current usage metrics show cumulative count of Article Views (full-text article views including HTML views, PDF and ePub downloads, according to the available data) and Abstracts Views on Vision4Press platform.
Data correspond to usage on the plateform after 2015. The current usage metrics is available 48-96 hours after online publication and is updated daily on week days.
Initial download of the metrics may take a while.