Fig. 12.
Download original image
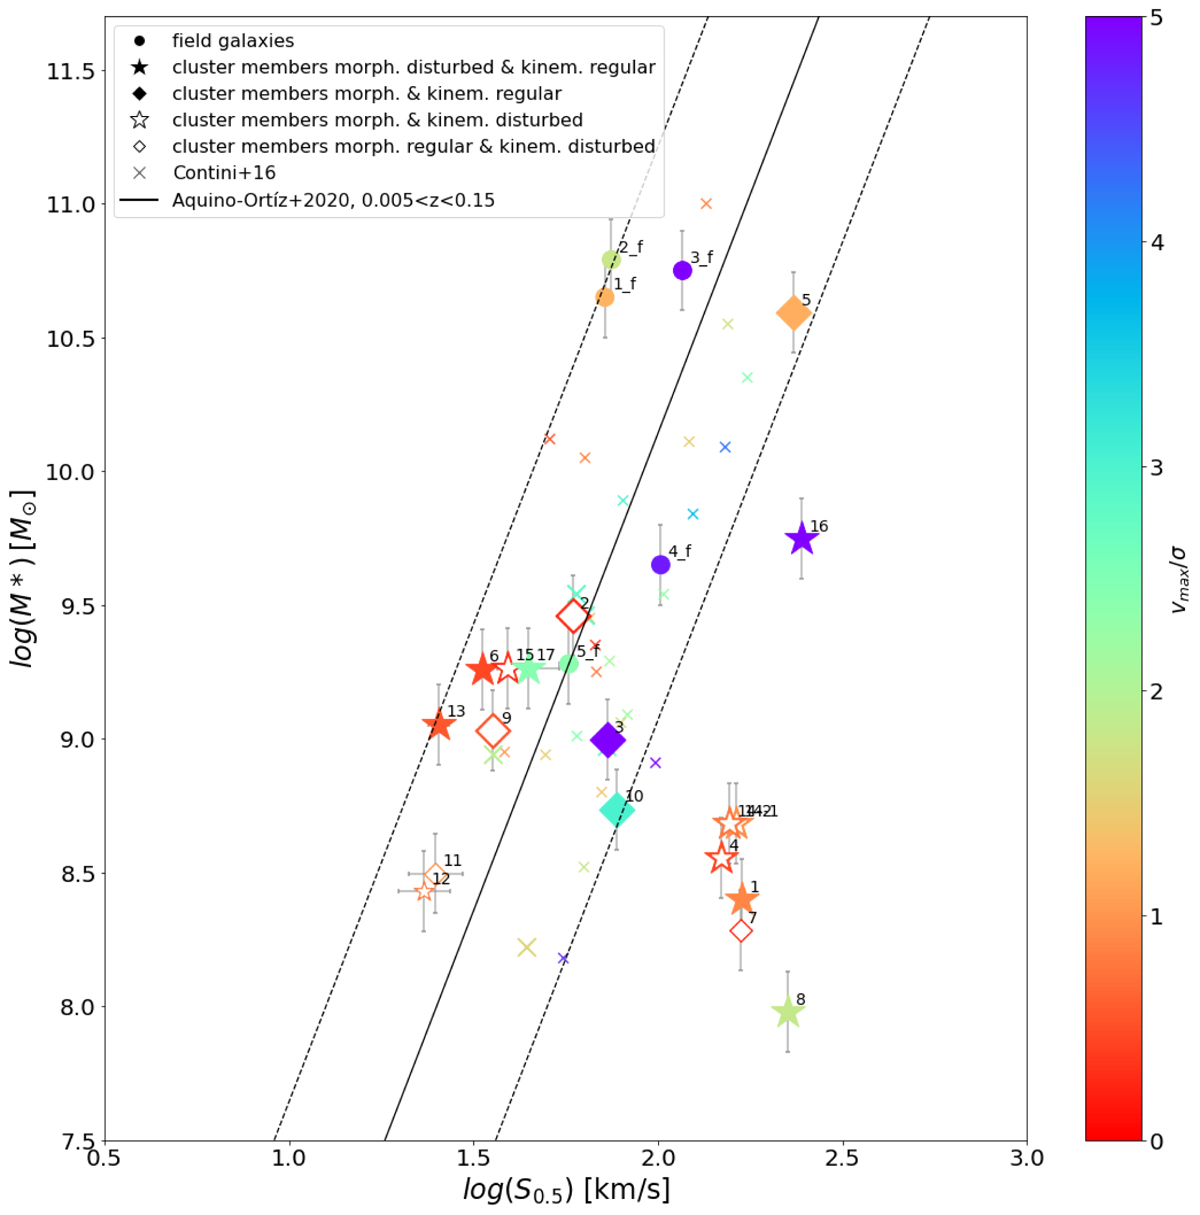
Stellar mass–S0.5 relation for the sample of M0416 cluster and field galaxies. The symbols are the same as in Fig. 11. The black line shows the stellar mass–S0.5 relation from Aquino-Ortíz et al. (2020), based on a large sample of local galaxies observed as part of the MaNGA survey. The dashed lines show the 2σ scatter around this relation.
Current usage metrics show cumulative count of Article Views (full-text article views including HTML views, PDF and ePub downloads, according to the available data) and Abstracts Views on Vision4Press platform.
Data correspond to usage on the plateform after 2015. The current usage metrics is available 48-96 hours after online publication and is updated daily on week days.
Initial download of the metrics may take a while.