Fig. 11.
Download original image
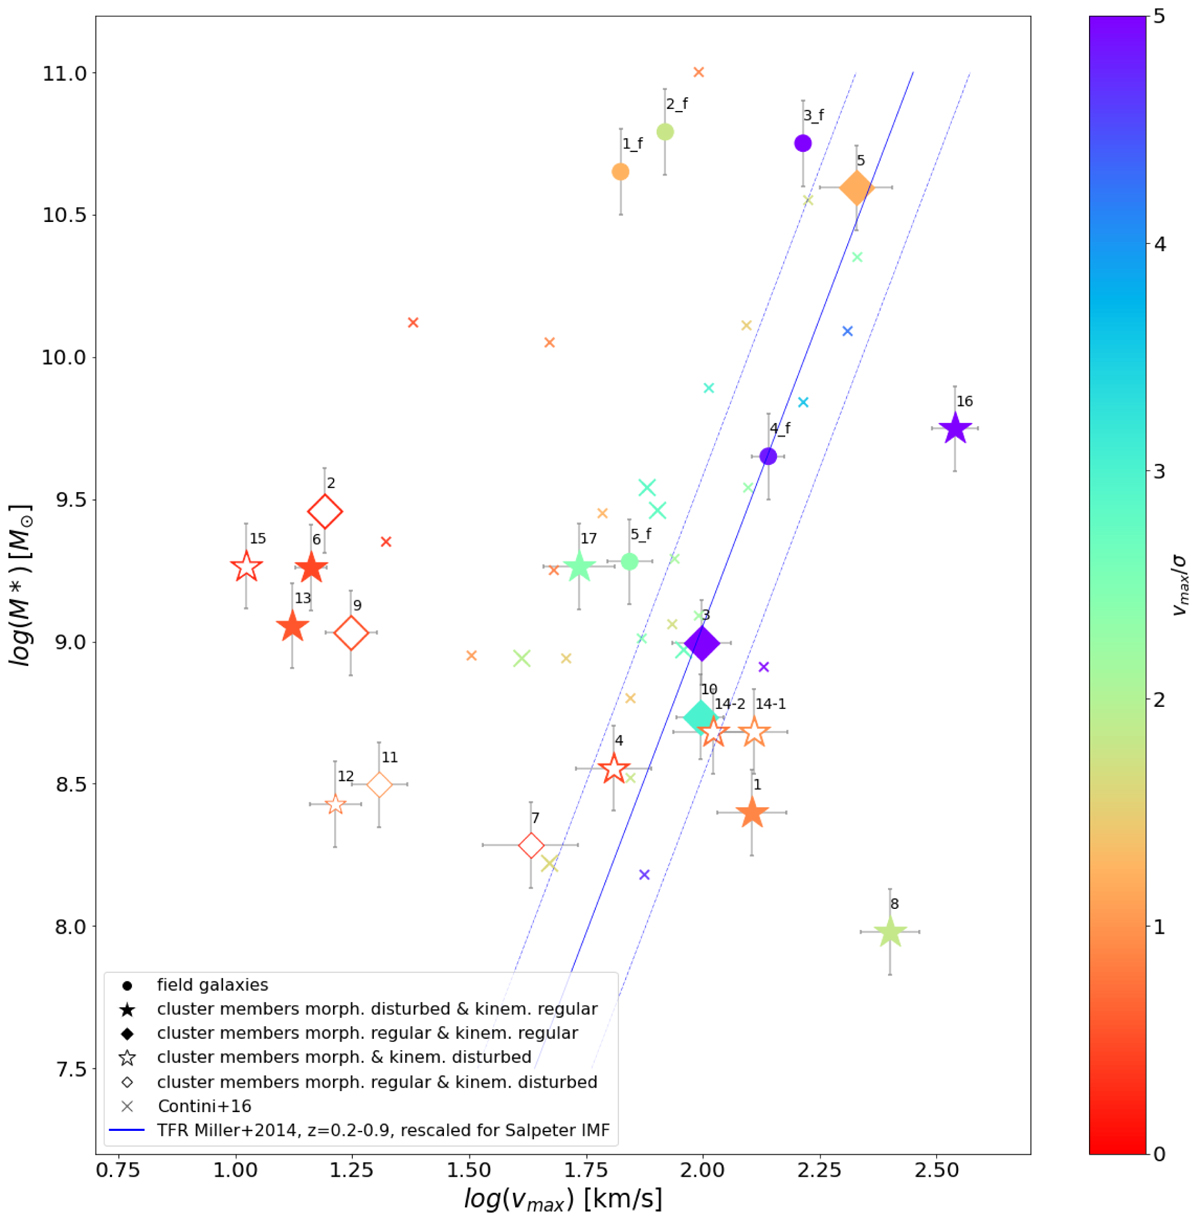
Tully–Fisher relation for the sample of M0416 cluster and field galaxies. The symbols are the same as in Fig. 4. In addition, we also show here the spatially resolved sample of MUSE galaxies from HDFS from Contini et al. (2016), with redshifts 0.2 < z < 1.4, as small crosses. The larger, brighter crosses are the galaxies from the latter authors with 0.3 < z < 0.5. The blue line shows the TFR from Miller et al. (2014) for low-mass galaxies with redshifts 0.2 < z < 0.9. The dotted lines show the 1σ scatter around this relation.
Current usage metrics show cumulative count of Article Views (full-text article views including HTML views, PDF and ePub downloads, according to the available data) and Abstracts Views on Vision4Press platform.
Data correspond to usage on the plateform after 2015. The current usage metrics is available 48-96 hours after online publication and is updated daily on week days.
Initial download of the metrics may take a while.