Fig. 9
Download original image
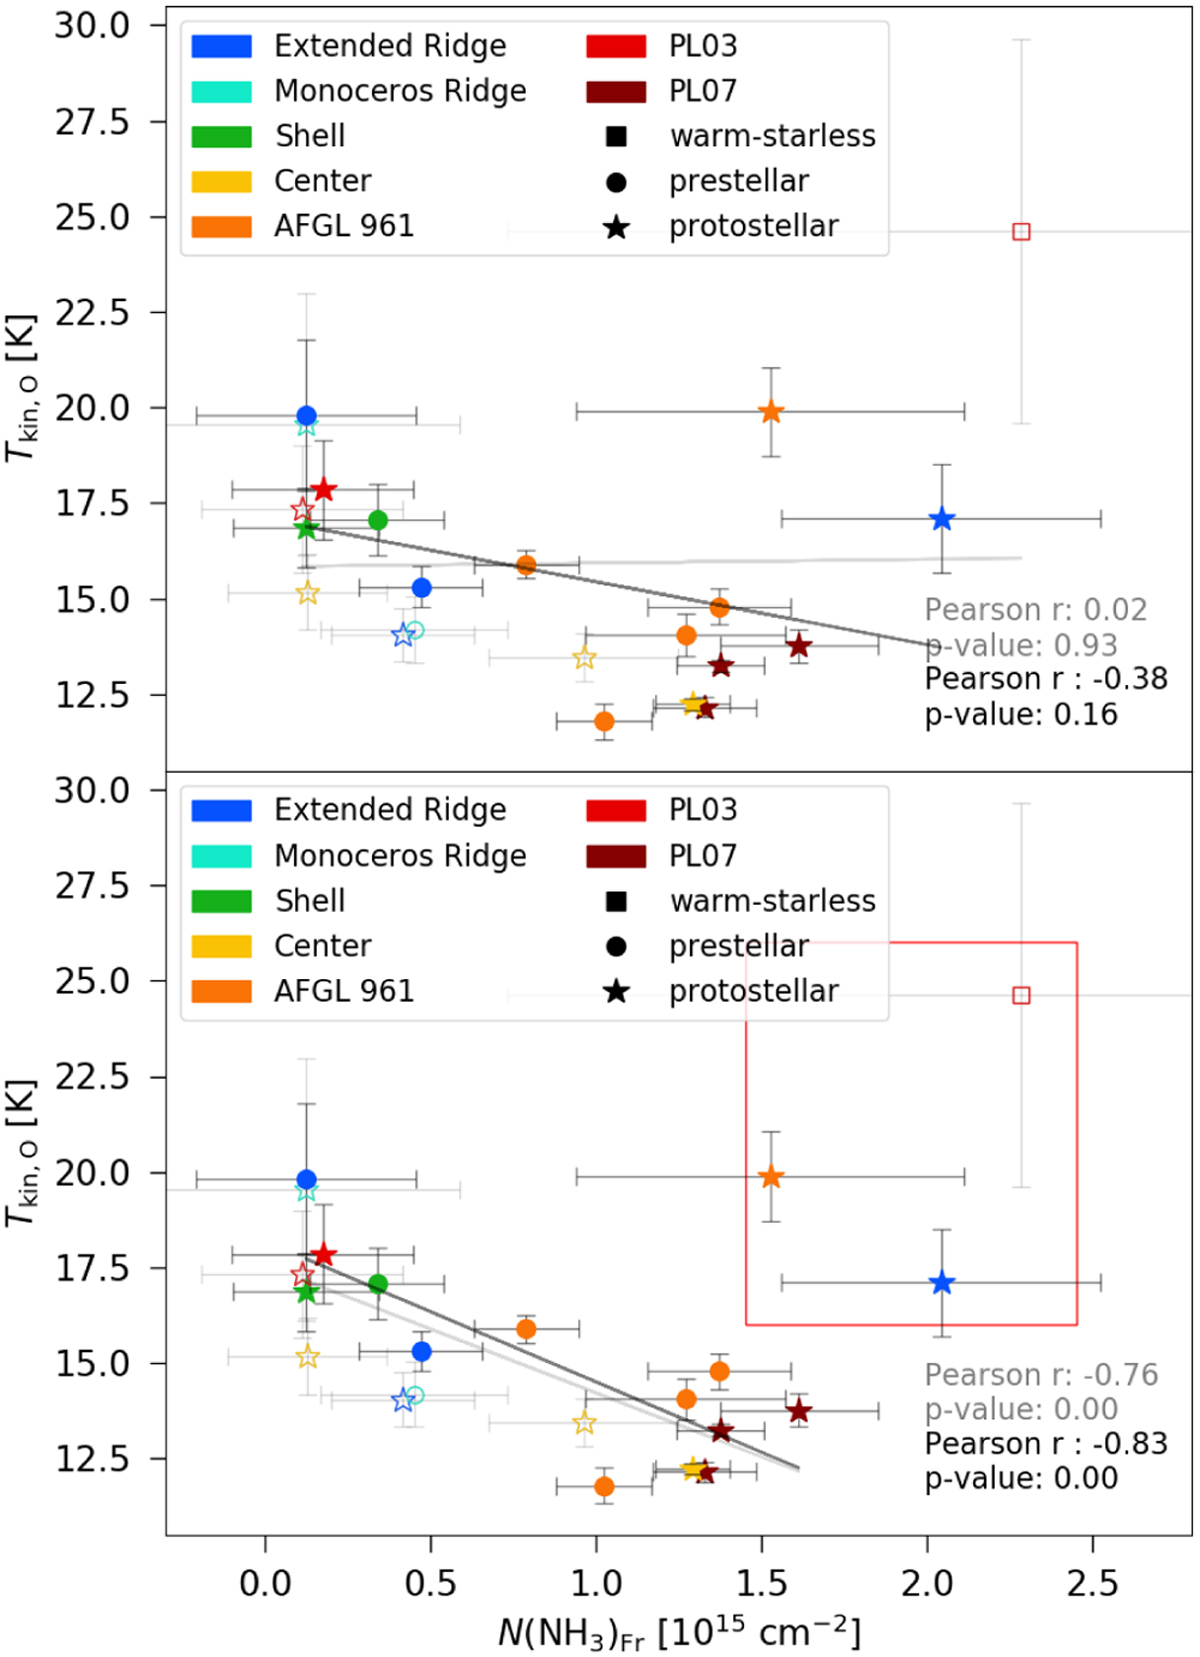
NH3 column density and kinetic temperature. The symbols and colours are as in Fig. 4. The grey line indicates a linear fit for the whole sample, the black line for the reliable sample. The Pearson correlation coefficients are noted with the same colours. Bottom: The red square indicates three outlier sources, which have been excluded from the correlation measurements in this panel.
Current usage metrics show cumulative count of Article Views (full-text article views including HTML views, PDF and ePub downloads, according to the available data) and Abstracts Views on Vision4Press platform.
Data correspond to usage on the plateform after 2015. The current usage metrics is available 48-96 hours after online publication and is updated daily on week days.
Initial download of the metrics may take a while.