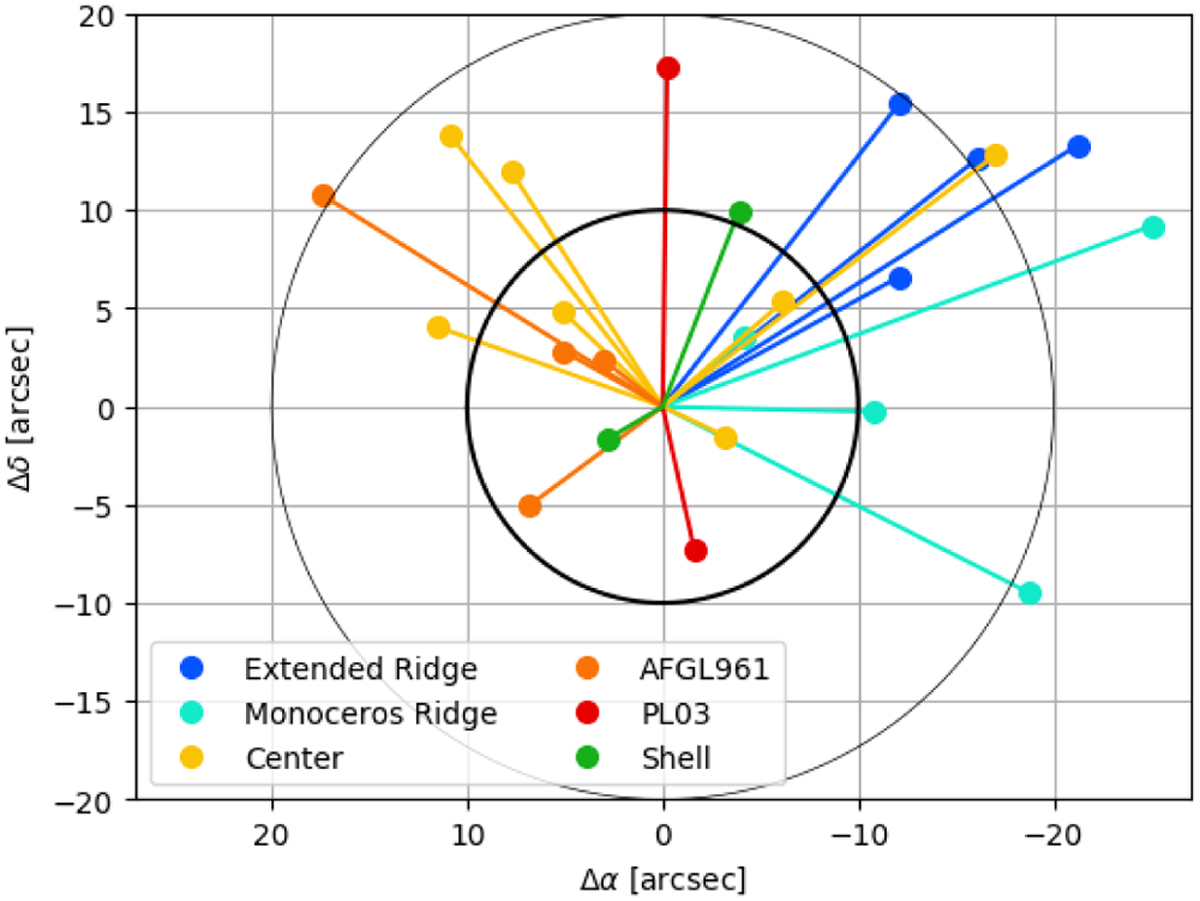
Fig. 8
Download original image
Spatial shift between the NH3 and dust maxima for targets where both KEYSTONE and Herschel data are available. For the missing sources, no maxima are visible for at least one dataset. The colours show the region hosting the source as mentioned in the legend. The shift of Δα = −18″, Δδ = 13″ corresponds to the isolated source east of the Center region. The circles have 10″ and 20″ radii, corresponding to 25% and 50% of the Effelsberg beam size, and to 31% and 62% of the GBT beam size.
Current usage metrics show cumulative count of Article Views (full-text article views including HTML views, PDF and ePub downloads, according to the available data) and Abstracts Views on Vision4Press platform.
Data correspond to usage on the plateform after 2015. The current usage metrics is available 48-96 hours after online publication and is updated daily on week days.
Initial download of the metrics may take a while.