Fig. 7
Download original image
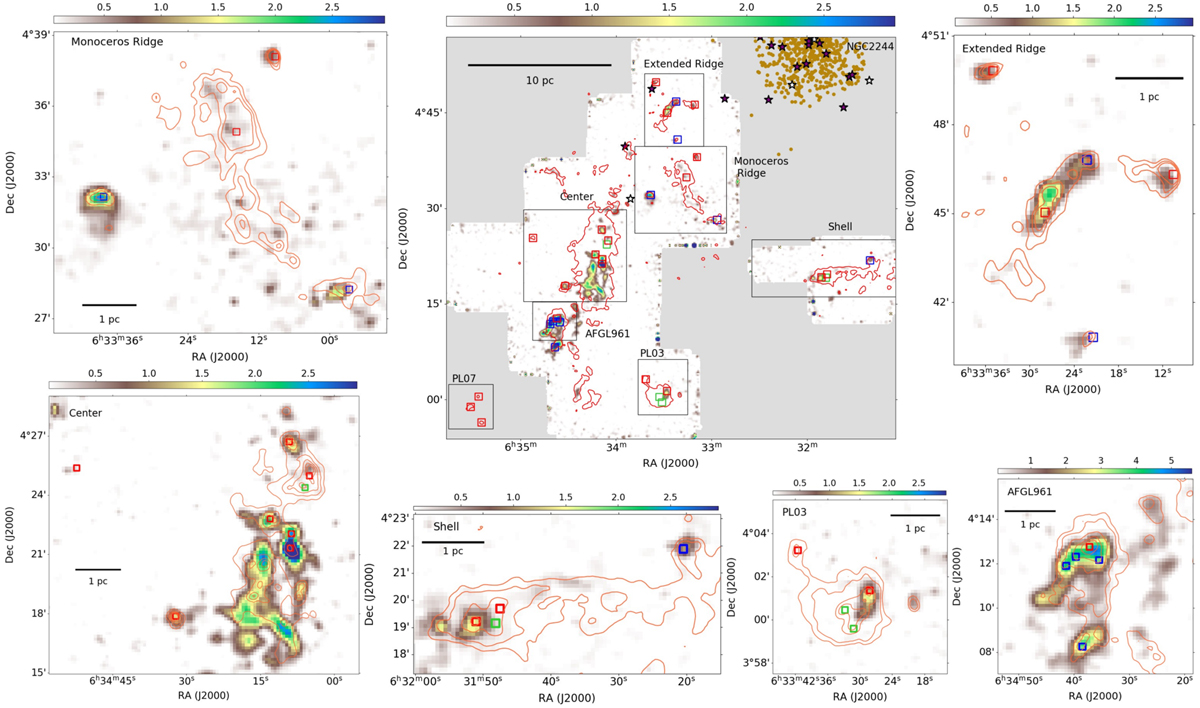
Integrated NH3 intensity from Keown et al. (2019) in K km s−1. The red contours show the Herschel dust emission at 250 µm. In the central map, the grey area indicates the zone not covered by Keown et al. (2019) observations, and the contour is at level 400 MJy sr−1. In the close up views of the region, the contours are at levels of 400, 500, and 600 MJy sr−1 for the Monoceros Ridge and the Extended Ridge; at 400, 500, 1000, and 1500 MJy sr−1 for PL03; at 400, 500, 1000, and 2000 MJy sr−1 for the Shell; at 400, 500, 1000, 2000, and 4000 MJy sr−1 for AFGL 961; and at 600, 800, 1000, 1200, and 1400 MJy sr−1 for the Center. The open squares show the Effelsberg targets with the same colour code as in Fig. 1.
Current usage metrics show cumulative count of Article Views (full-text article views including HTML views, PDF and ePub downloads, according to the available data) and Abstracts Views on Vision4Press platform.
Data correspond to usage on the plateform after 2015. The current usage metrics is available 48-96 hours after online publication and is updated daily on week days.
Initial download of the metrics may take a while.