Fig. 6
Download original image
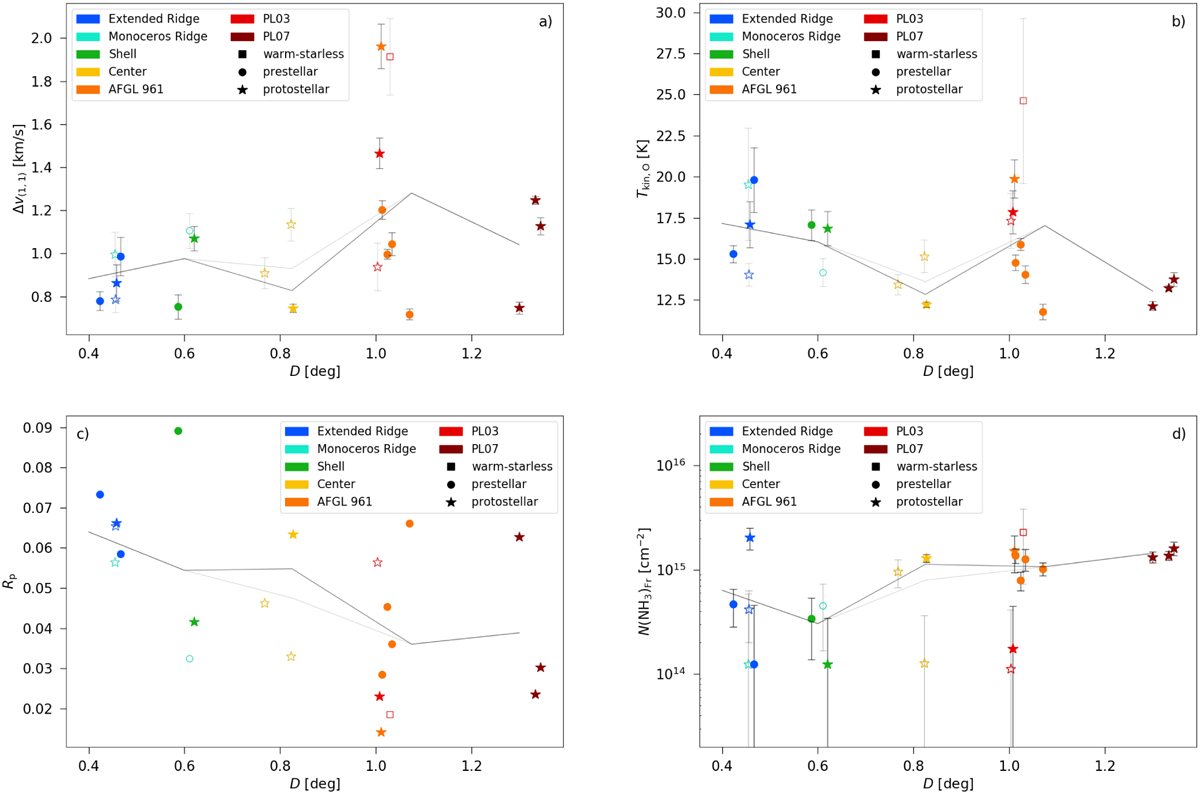
(a) NH3 (1,1) line width, (b) kinetic temperature, (c) gas pressure ratio, and (d) column density plotted against the projected distance of the cores from NGC 2244. The filled points mark the reliable sample, the open points the candidate sample. The black and the grey lines indicate a running median of the values using non-uniform binning for the reliable and for the whole sample, respectively. The distances are shown in degrees with 1° corresponding to 28 pc at a distance of 1.6 kpc.
Current usage metrics show cumulative count of Article Views (full-text article views including HTML views, PDF and ePub downloads, according to the available data) and Abstracts Views on Vision4Press platform.
Data correspond to usage on the plateform after 2015. The current usage metrics is available 48-96 hours after online publication and is updated daily on week days.
Initial download of the metrics may take a while.