Fig. 3
Download original image
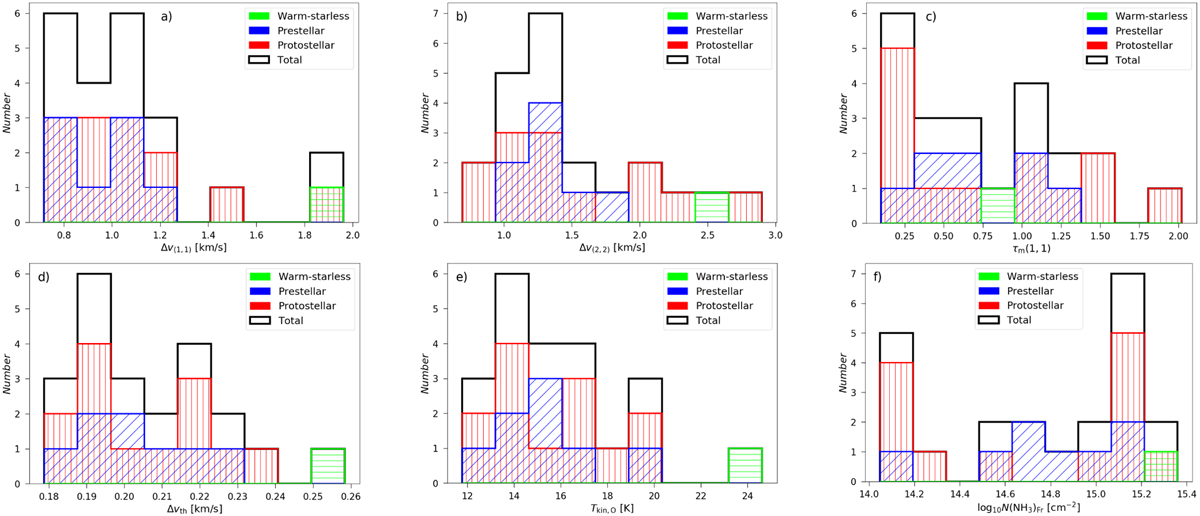
Distributions of the obtained parameters according to the evolutionary stages of the sources covering both the reliable and the candidate sample. The colours represent warm-starless, protostellar, and prestellar cores, and the black outline represents the whole sample, as indicated in the legend. The histograms are (a) NH3 (1,1) line width, (b) NH3 (2,2) line width, (c) NH3 (1,1) main hyperfine component optical depth – all of which are from CLASS fitting (see Sect. 2.2) –, (d) thermal line width calculated from Eq. (6), (e) kinetic temperature calculated from Eq. (2), and (f) NH3 column density calculated from Eq. (13).
Current usage metrics show cumulative count of Article Views (full-text article views including HTML views, PDF and ePub downloads, according to the available data) and Abstracts Views on Vision4Press platform.
Data correspond to usage on the plateform after 2015. The current usage metrics is available 48-96 hours after online publication and is updated daily on week days.
Initial download of the metrics may take a while.