Fig. F.3
Download original image
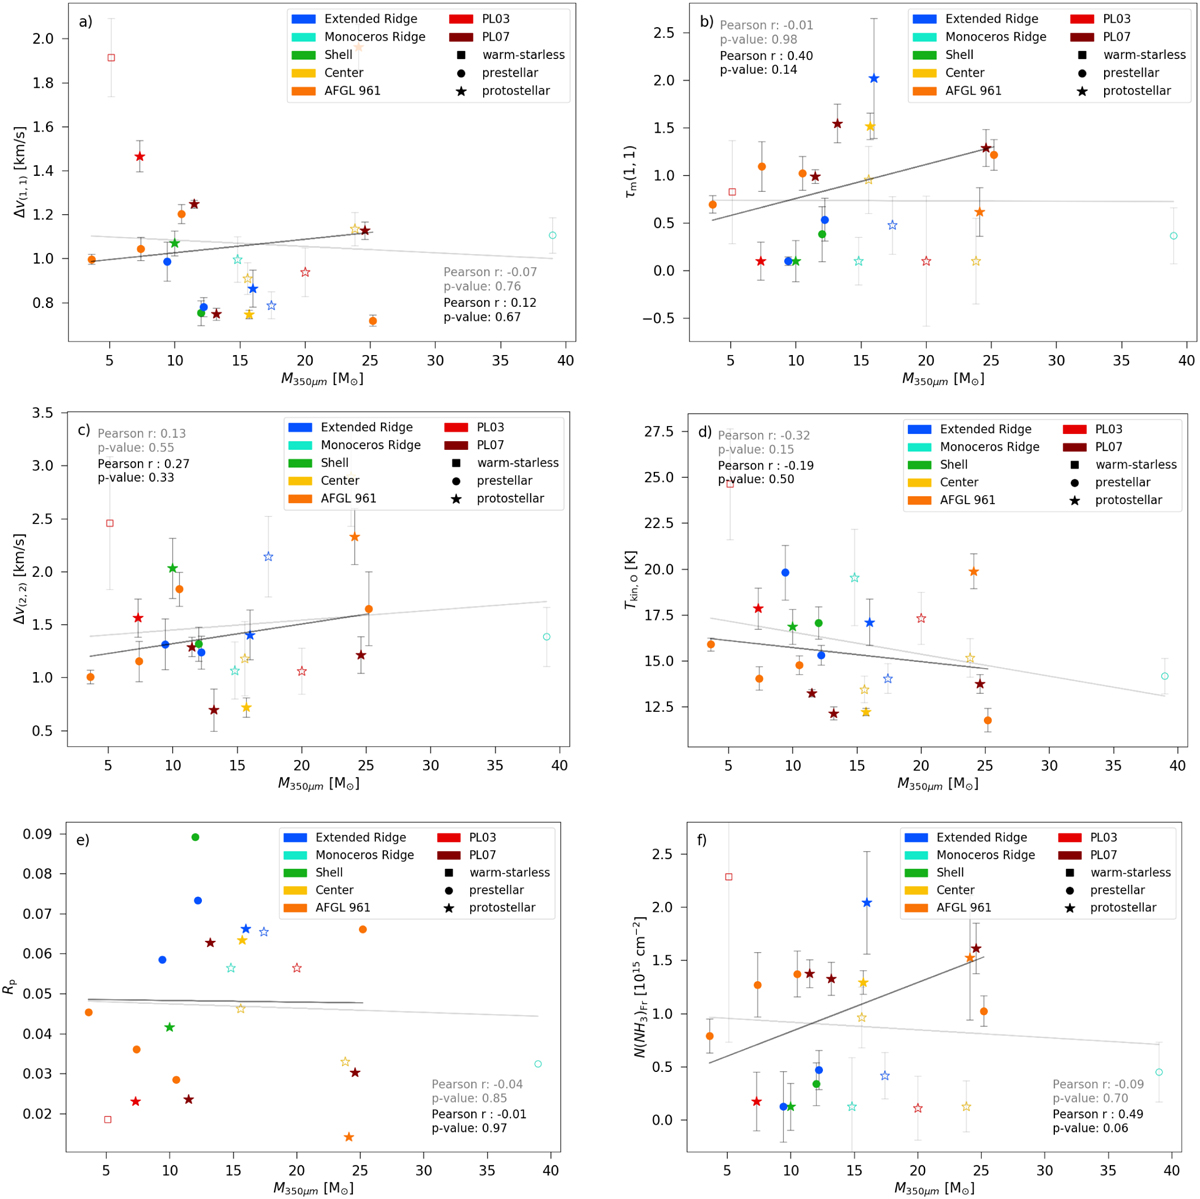
NH3 (1,1) and (2,2) line width, gas pressure ratio, (1,1) main hyperfine component optical depth, kinetic temperature and column density plotted against the mass of the cores calculated from Herschel dust data. The filled points mark the reliable sample, the open points the candidate sample. The grey line indicates a linear fit for the two parameters for the whole sample, the black line for the reliable sample. The Pearson correlation coefficients are noted with the same colours.
Current usage metrics show cumulative count of Article Views (full-text article views including HTML views, PDF and ePub downloads, according to the available data) and Abstracts Views on Vision4Press platform.
Data correspond to usage on the plateform after 2015. The current usage metrics is available 48-96 hours after online publication and is updated daily on week days.
Initial download of the metrics may take a while.