Fig. E.2
Download original image
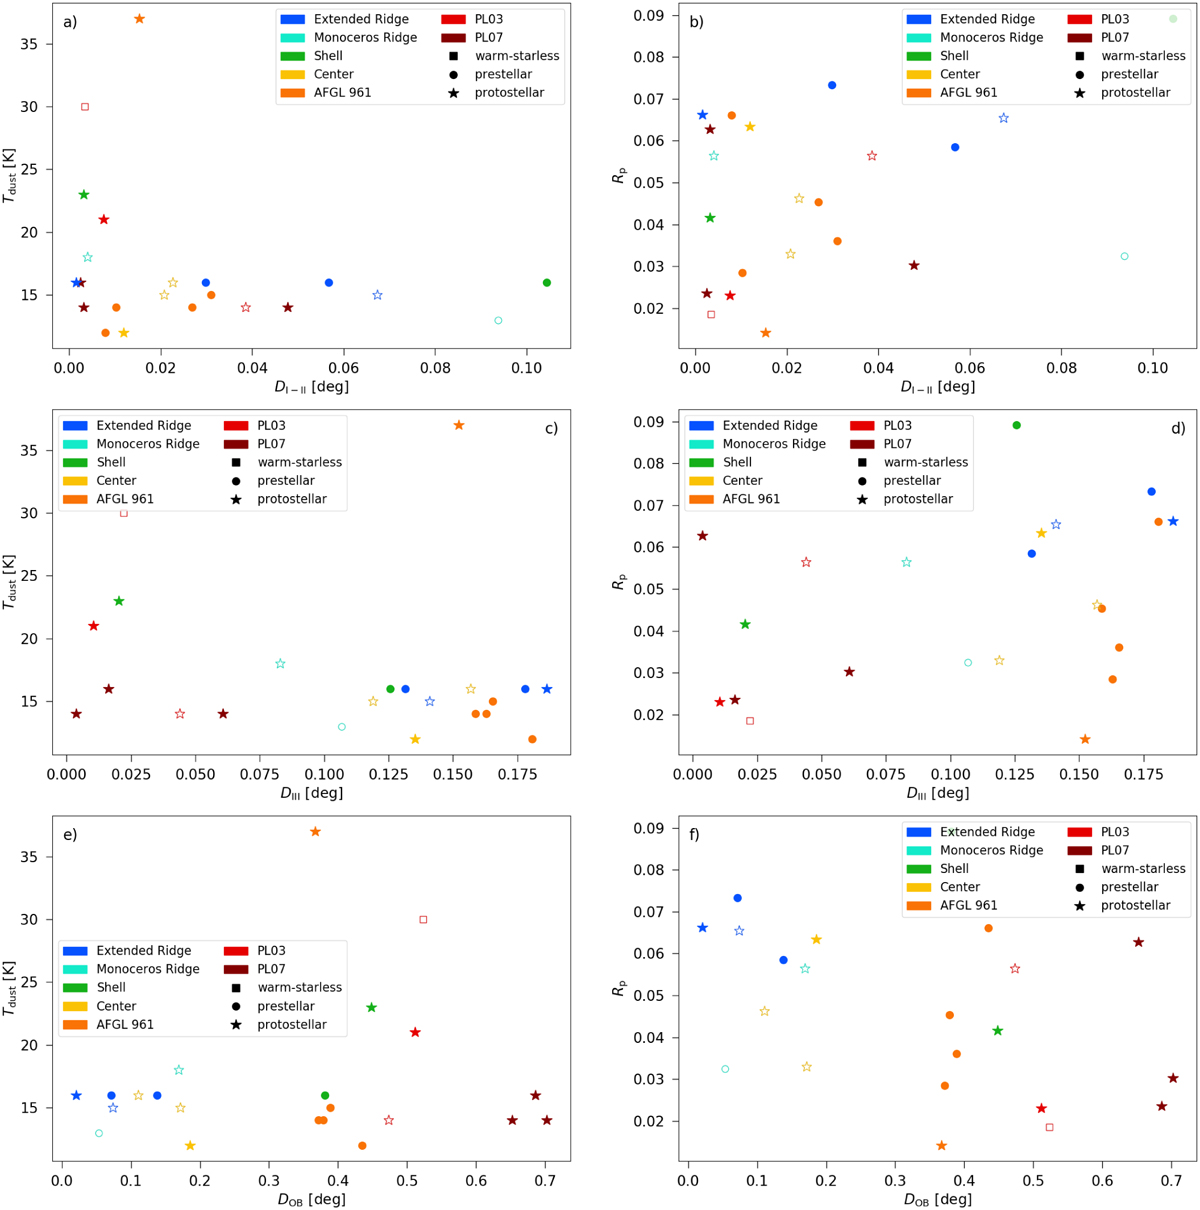
Distance of the cores from the closest Class I/II (top row) or Class III YSO candidate (middle row) or O/B star (bottom row) plotted against dust temperature and gas pressure ratio. The spread of the values is declining as the distance between the cores and Class I/II candidates grow but such trend cannot be seen in the cases of Class III candidates or the O/B stars.
Current usage metrics show cumulative count of Article Views (full-text article views including HTML views, PDF and ePub downloads, according to the available data) and Abstracts Views on Vision4Press platform.
Data correspond to usage on the plateform after 2015. The current usage metrics is available 48-96 hours after online publication and is updated daily on week days.
Initial download of the metrics may take a while.