Fig. A.1
Download original image
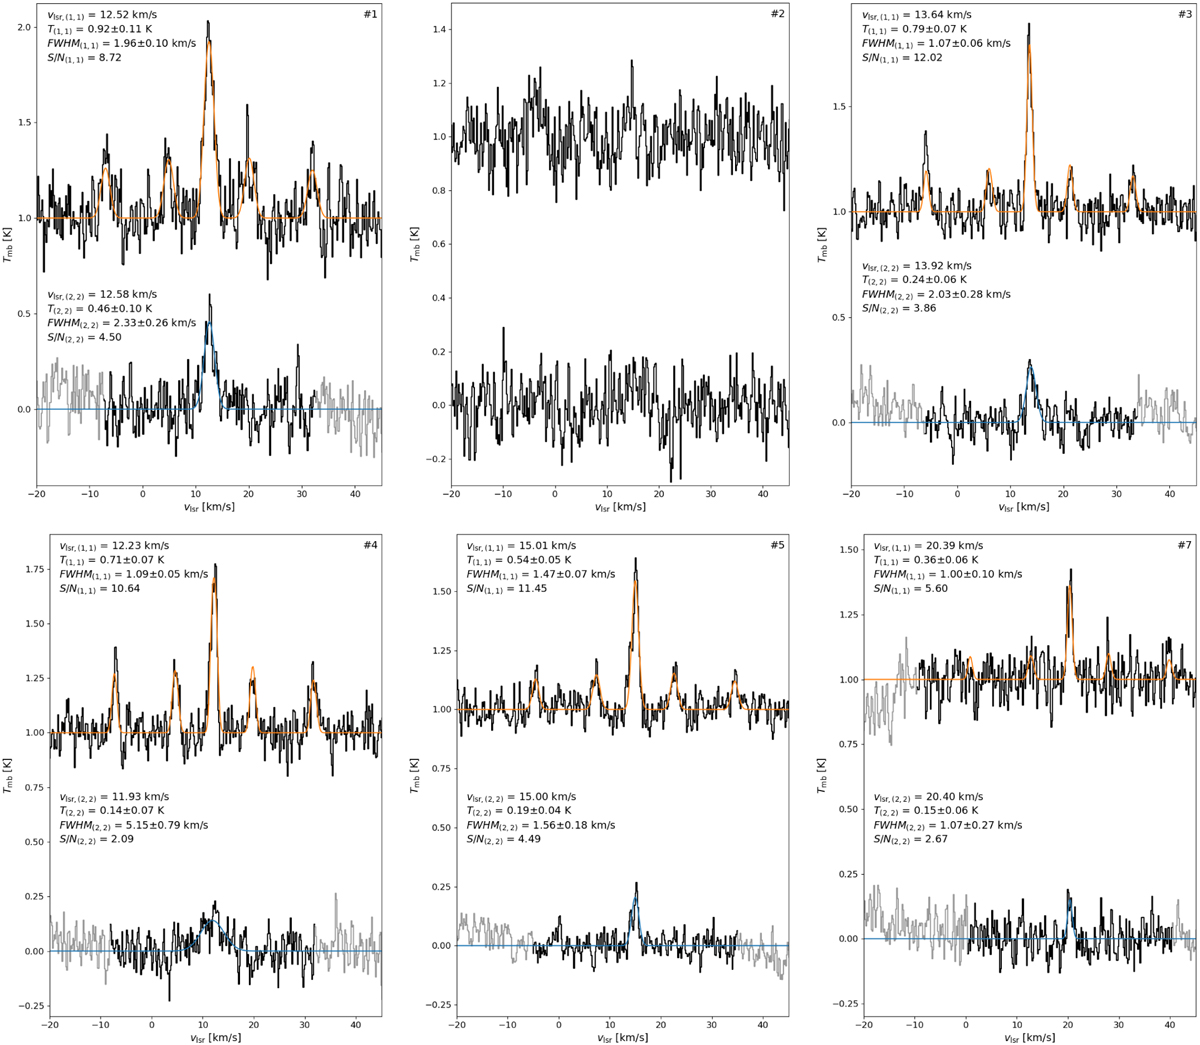
Ammonia spectra for cores #1 to #5 and #7, as indicated in the top-right corner of each frame. In each panel, the top spectrum is the NH3 (1,1) spectrum shifted by 1 K. The orange line shows the CLASS hyperfine best fit obtained. The bottom spectrum is NH3 (2,2) spectrum. The blue line shows the Gaussian best fit. The best-fit centroid velocity, peak Tmb, FWHM, and S/N are included for both transitions. The grey parts of the spectra were outside the analysed velocity range, which were defined around the vIsr(1,1) and vIsr(2,2) values.
Current usage metrics show cumulative count of Article Views (full-text article views including HTML views, PDF and ePub downloads, according to the available data) and Abstracts Views on Vision4Press platform.
Data correspond to usage on the plateform after 2015. The current usage metrics is available 48-96 hours after online publication and is updated daily on week days.
Initial download of the metrics may take a while.